Geo Elevation
Can you see it from here? Stand there and look.
Can the mountain be seen from the ridge, 86 miles away? What can be seen from the overlook, and what does the ground hide? How steep is that trail? Geo Elevation answers on a map. Draw a circle and it colors what its center can see, then puts you there to look around. Draw a straight path and it tells you whether its two ends see each other over the curve of the Earth. Draw any path and its elevation profile draws itself along the real trail or road; draw an area and the app reads the ground inside it every 30 meters: its slopes, its contours and the terrain itself in 3D.
Mac, iPad, iPhone, Apple Vision
One purchase for iPhone, iPad, Mac and Apple Vision Pro. No account, no subscription.
See it in action
Recorded in the app. Interface shown in English.
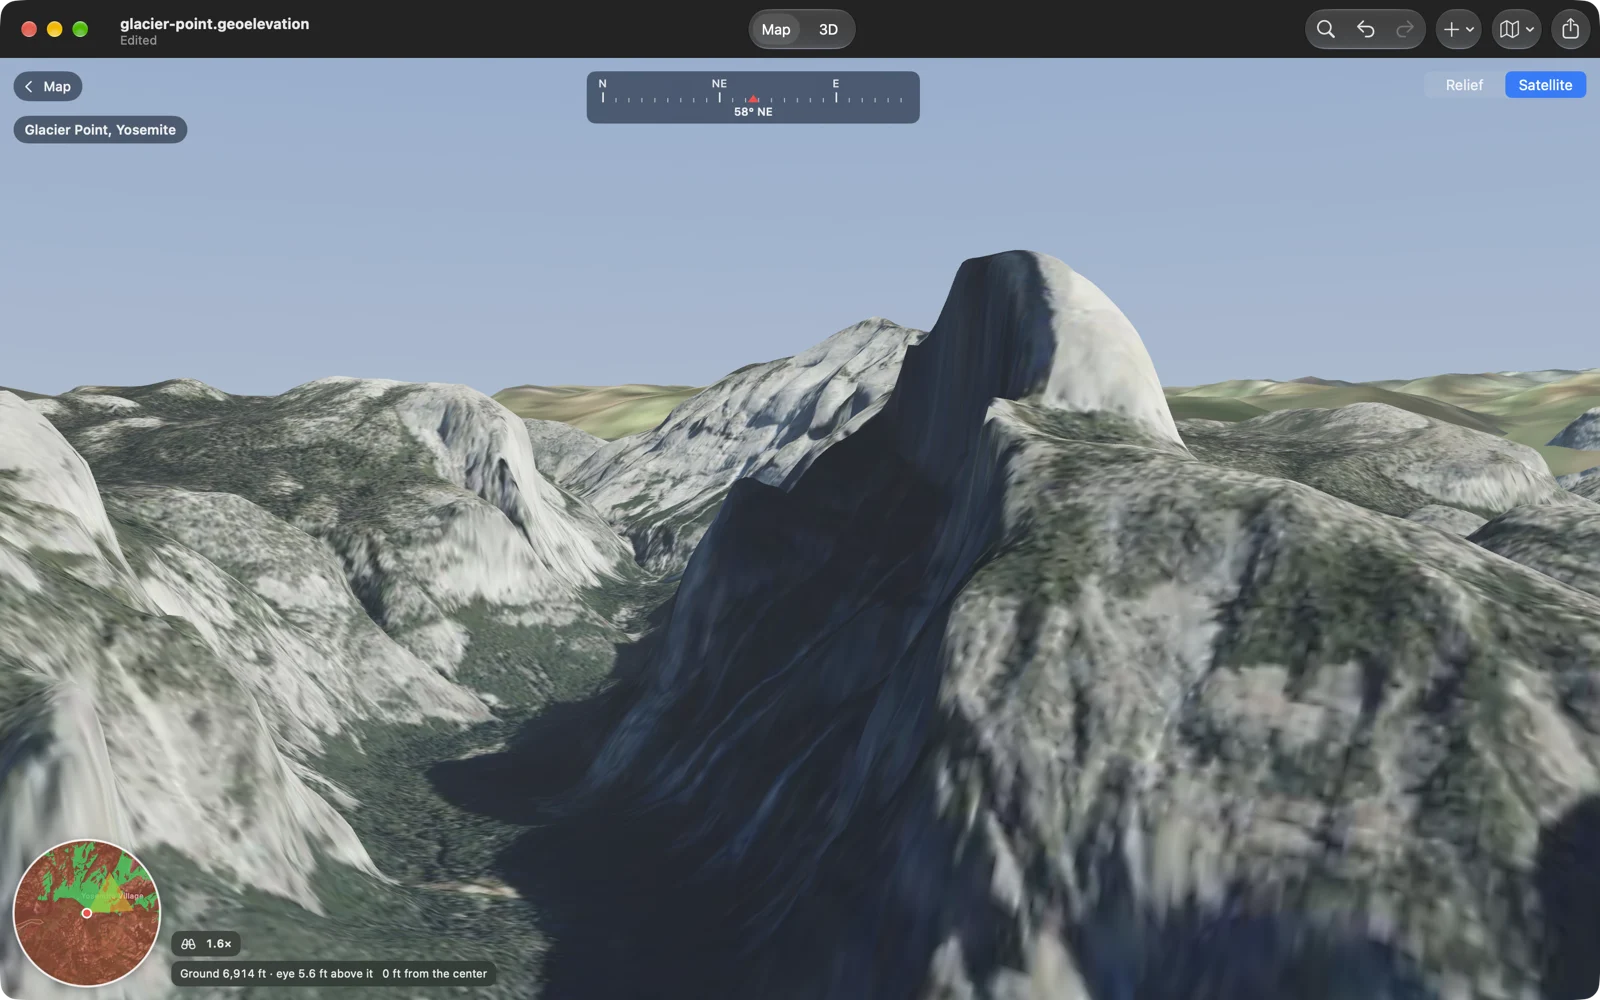
Stand there and look around
Draw a circle around a viewpoint and choose Look. You stand at its center, on foot, at the true height of the ground, and the land around you is drawn at its real scale and lowered for the curve of the Earth, with the land beyond the circle as the skyline. Look around, walk, zoom in up to 12 times, and the ground sharpens where you look. Shaded relief or satellite imagery, a compass along the top, and a mini map with the cone of your view in the corner. The picture above is Glacier Point in Yosemite, looking across the valley at Half Dome.
What can be seen from here
Draw a circle and turn on View from Center. The ground its center can see turns green and the ground hidden behind the ridges turns red, out to the circle’s edge, on the map and on the terrain in 3D, with the area and the share in view. Set the height of your eye, and the height of what you are looking for: a person, a roof, a tower. From Glacier Point, 18 percent of a five-mile circle is in view.
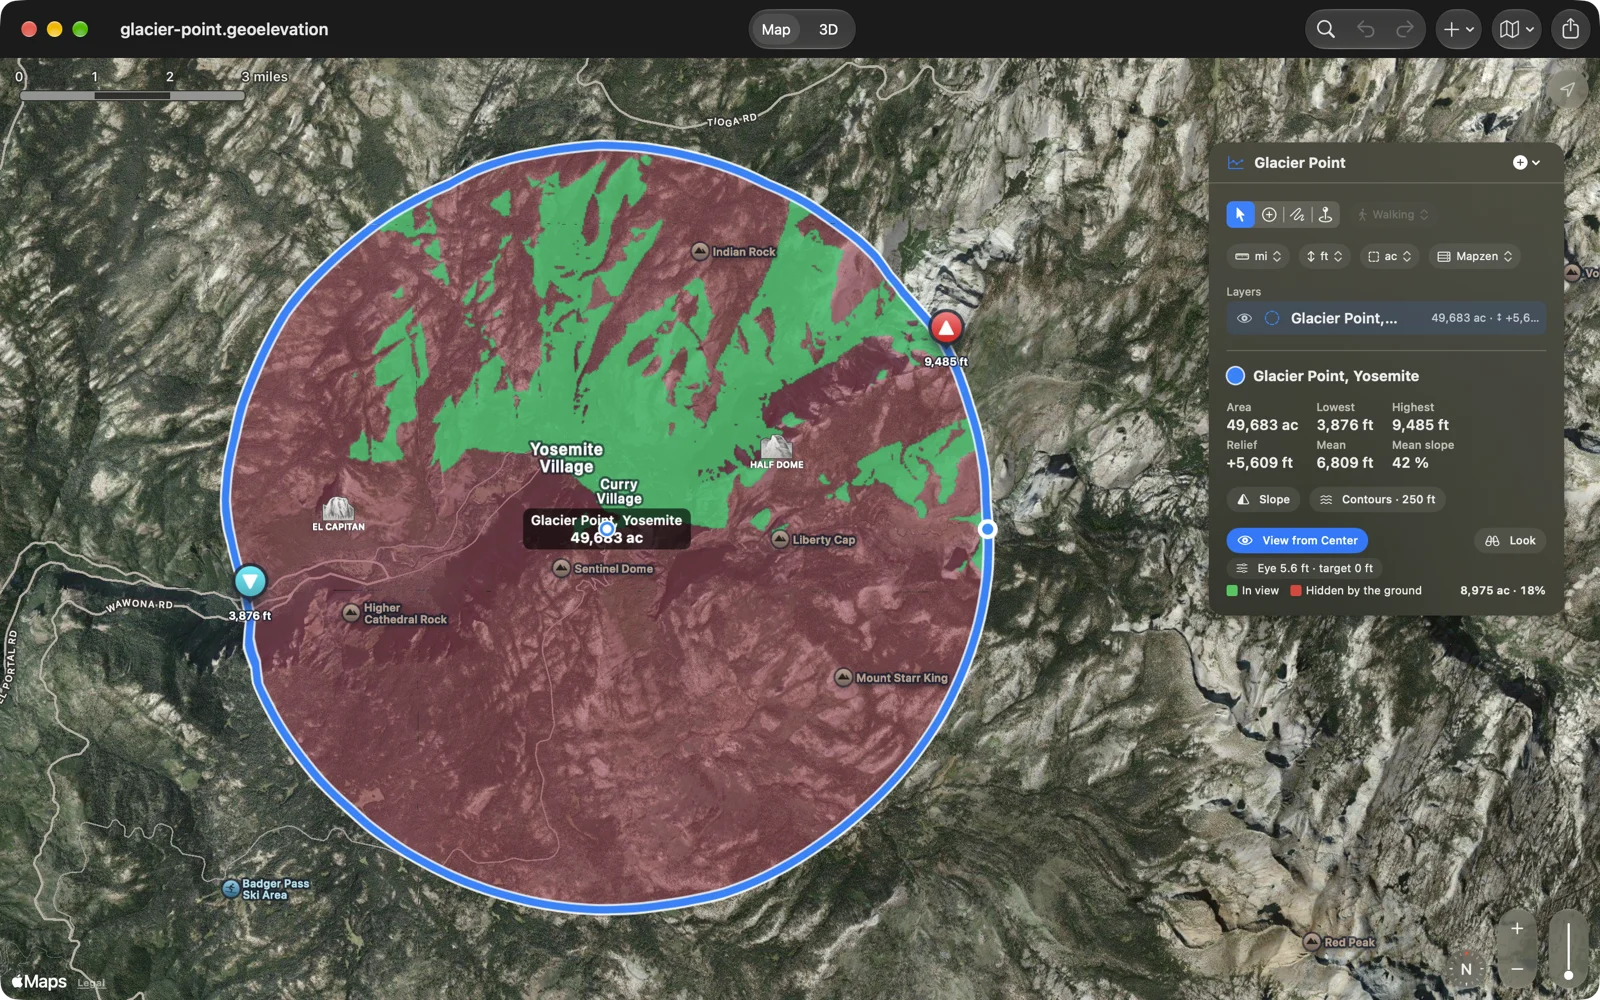
Can you see it from there?
Draw a straight path between two places and turn on Line of Sight with the binoculars beside the chart. The ground is drawn over the curve of the Earth, with sea level as the arc beneath it, and a line runs from your eye above the first point to the far end: green while it clears, orange from where the ground gets in the way, with a dot on the tightest spot and the clearance in feet or meters. Charlotte to Mount Mitchell is 86 miles, and the Earth drops away about 4,300 feet over that distance; the summit is in sight, with 619 feet to spare over the South Mountains.
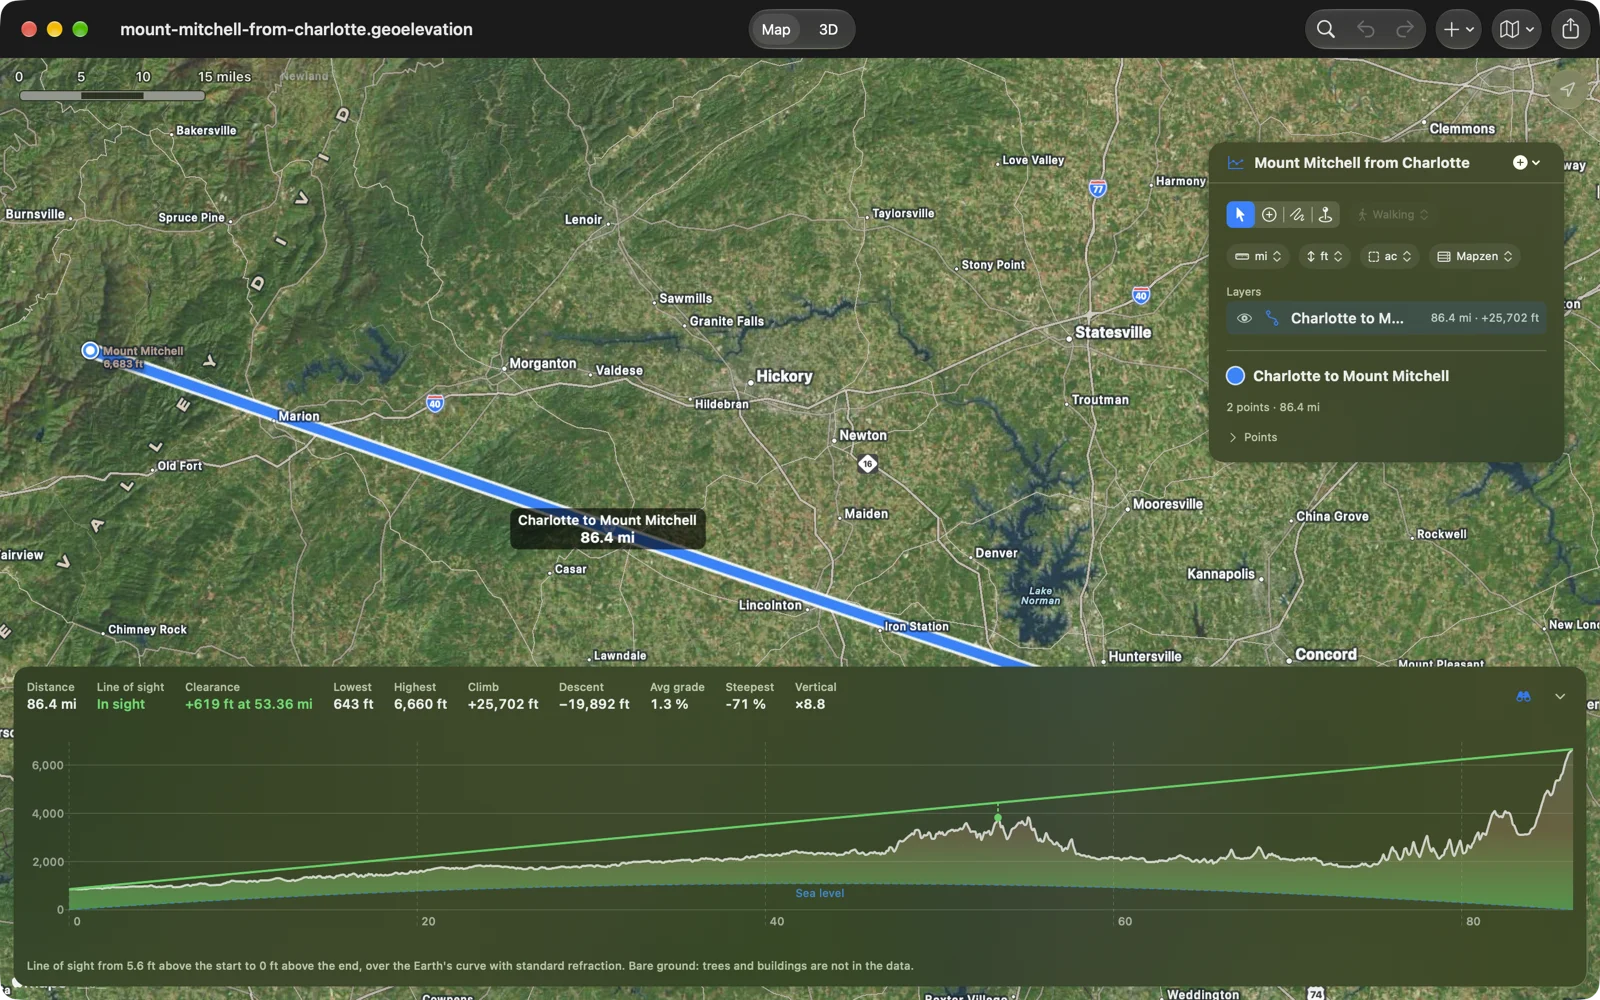
A path that follows the trail
Add a few points and choose Walking, Cycling or Driving beside the drawing tools: each leg follows the real path or road between them, switchbacks and all. A second after your last edit the profile is there, one sample every 30 meters, with the distance, the climb and the descent, the average grade and the steepest hundred meters. Move along the chart and a ring on the map shows where you are. Straight lines are one choice away.
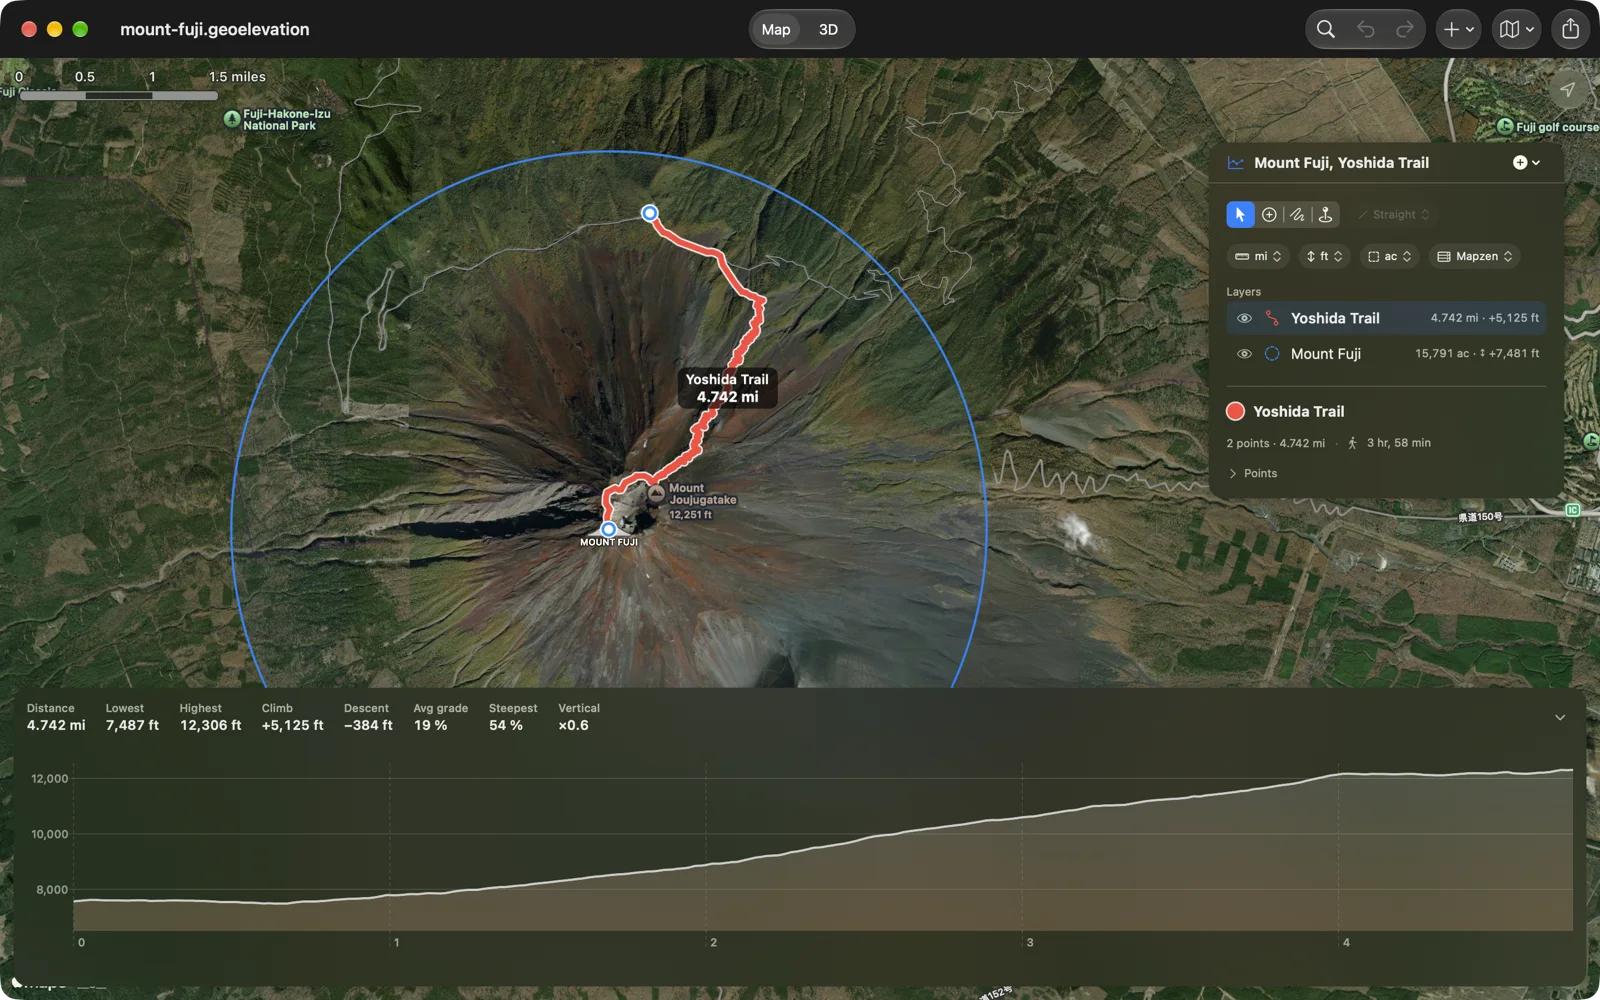
Draw an area. Read the ground.
Draw an area, a circle or a rectangle around the ground you care about, the summit, the valley, the whole mountain. Geo Elevation reads every 30 meters inside it and answers with the lowest, highest and mean height, the relief, the mean and the steepest slope, and marks the highest and lowest points on the map.
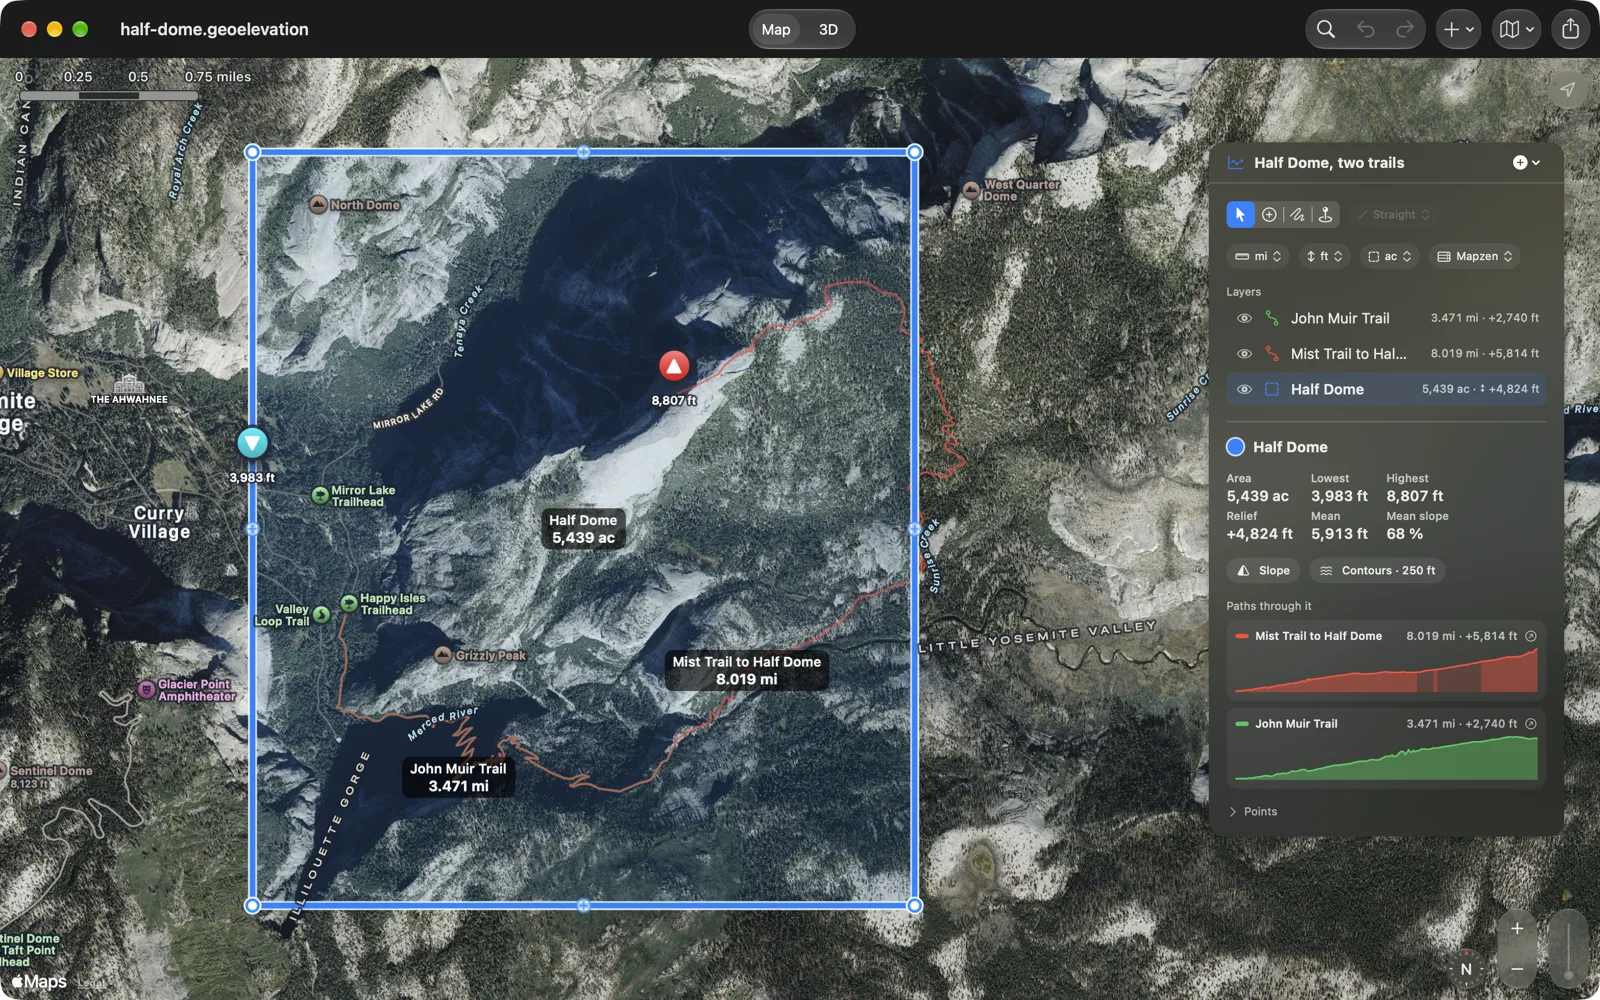
Slope and contours
Switch on Slope and the steep ground is colored the way avalanche maps do it, from the angle you choose, with the share of the area in each band. Switch on Contours and the lines come at a spacing that suits the relief, every fifth one heavier. Both lie on the map and on the ground in 3D, and both can be set lighter or stronger in Settings.
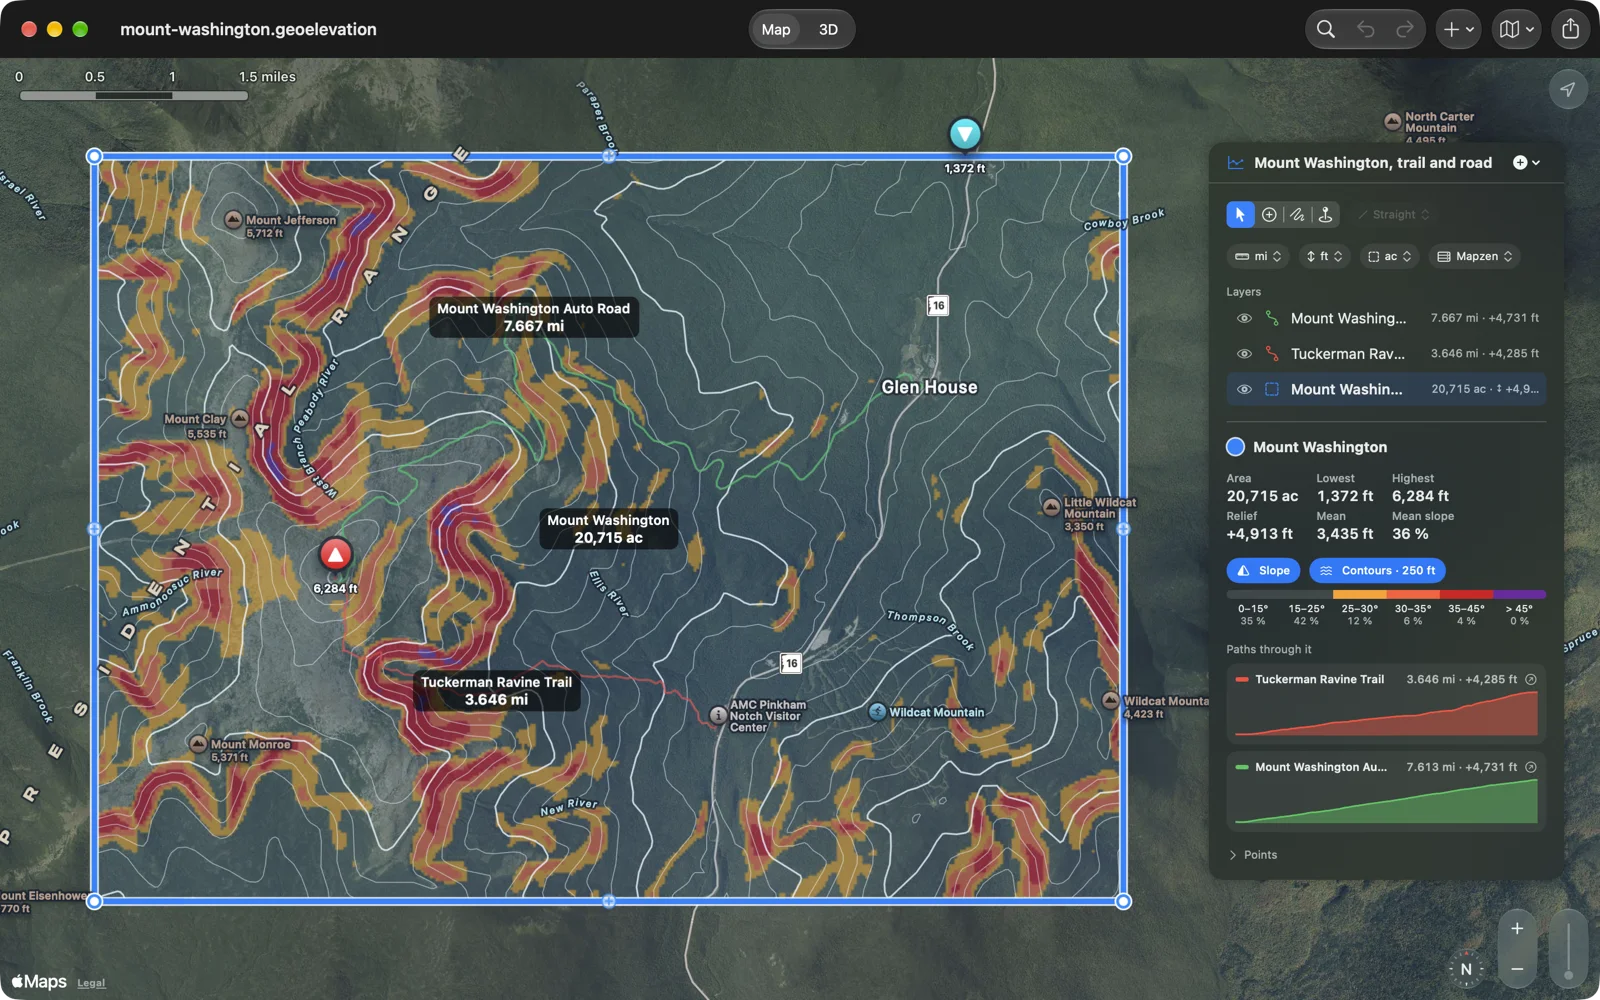
The ground in 3D
Switch to 3D and the area stands up as a block, the map imagery draped over it, the slope, the contours or the view from its center on it if you want them, and every path drawn on the surface. Turn it, zoom, raise the heights to see a gentle hill. Move along a path’s chart and a marker climbs the surface.
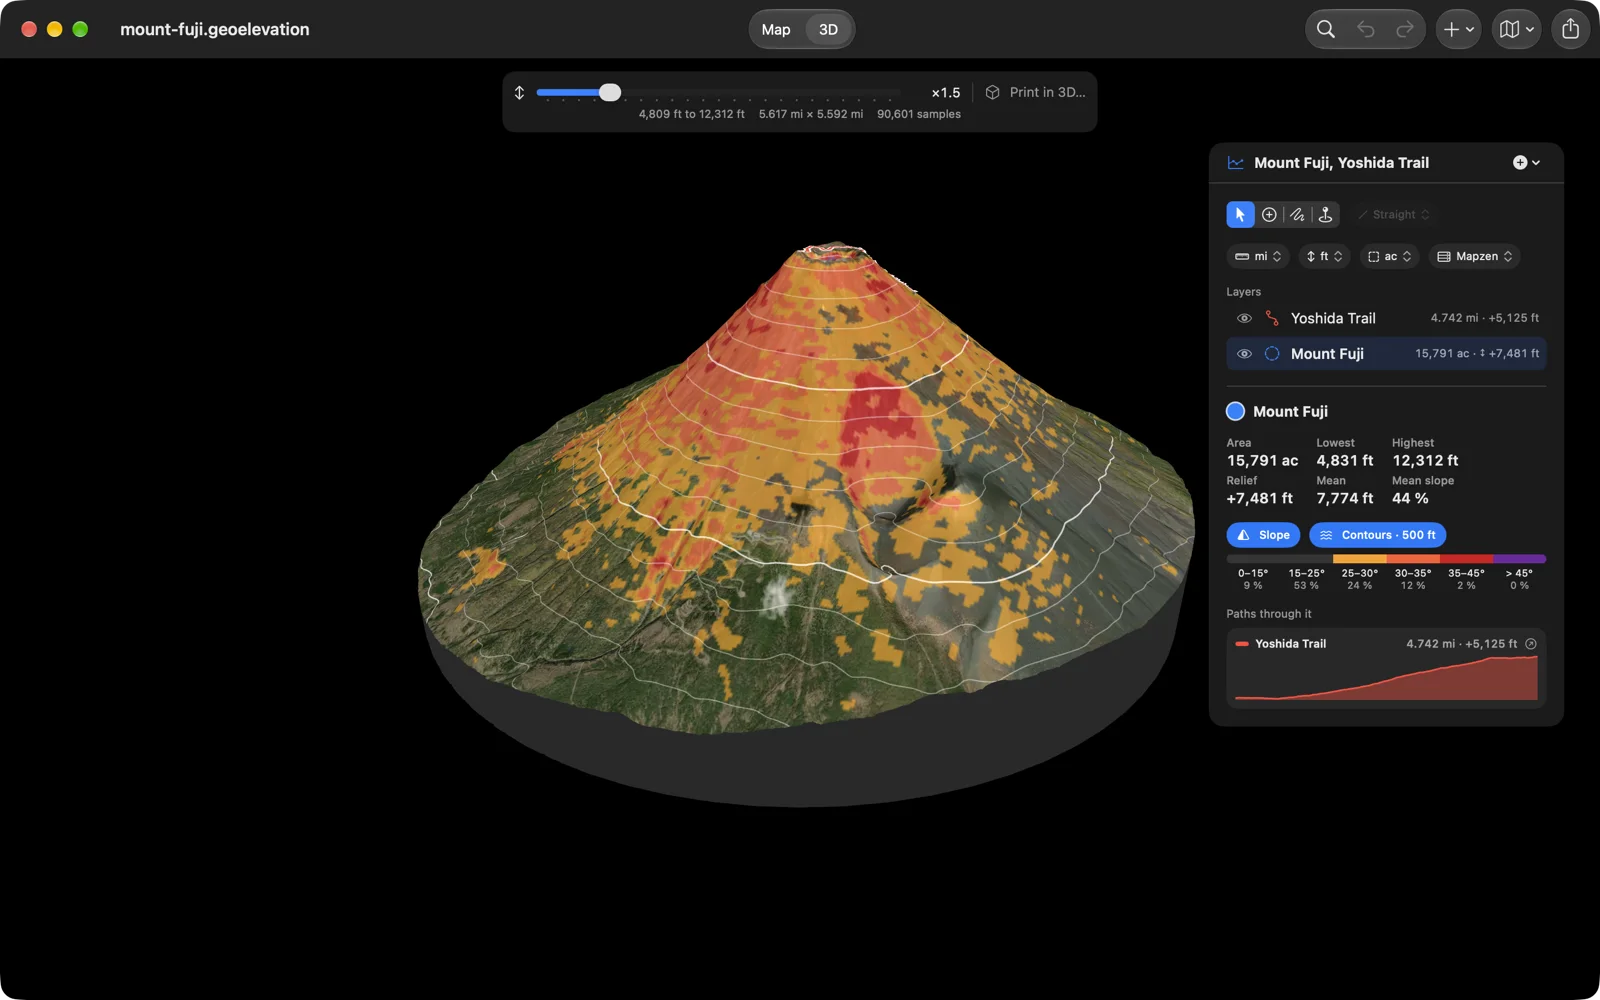
Every path through it
A document holds as many paths and areas as you like. Select an area and every path that crosses it is listed with a small profile of its own; scrub along it and the ring follows on the map, without leaving the area.
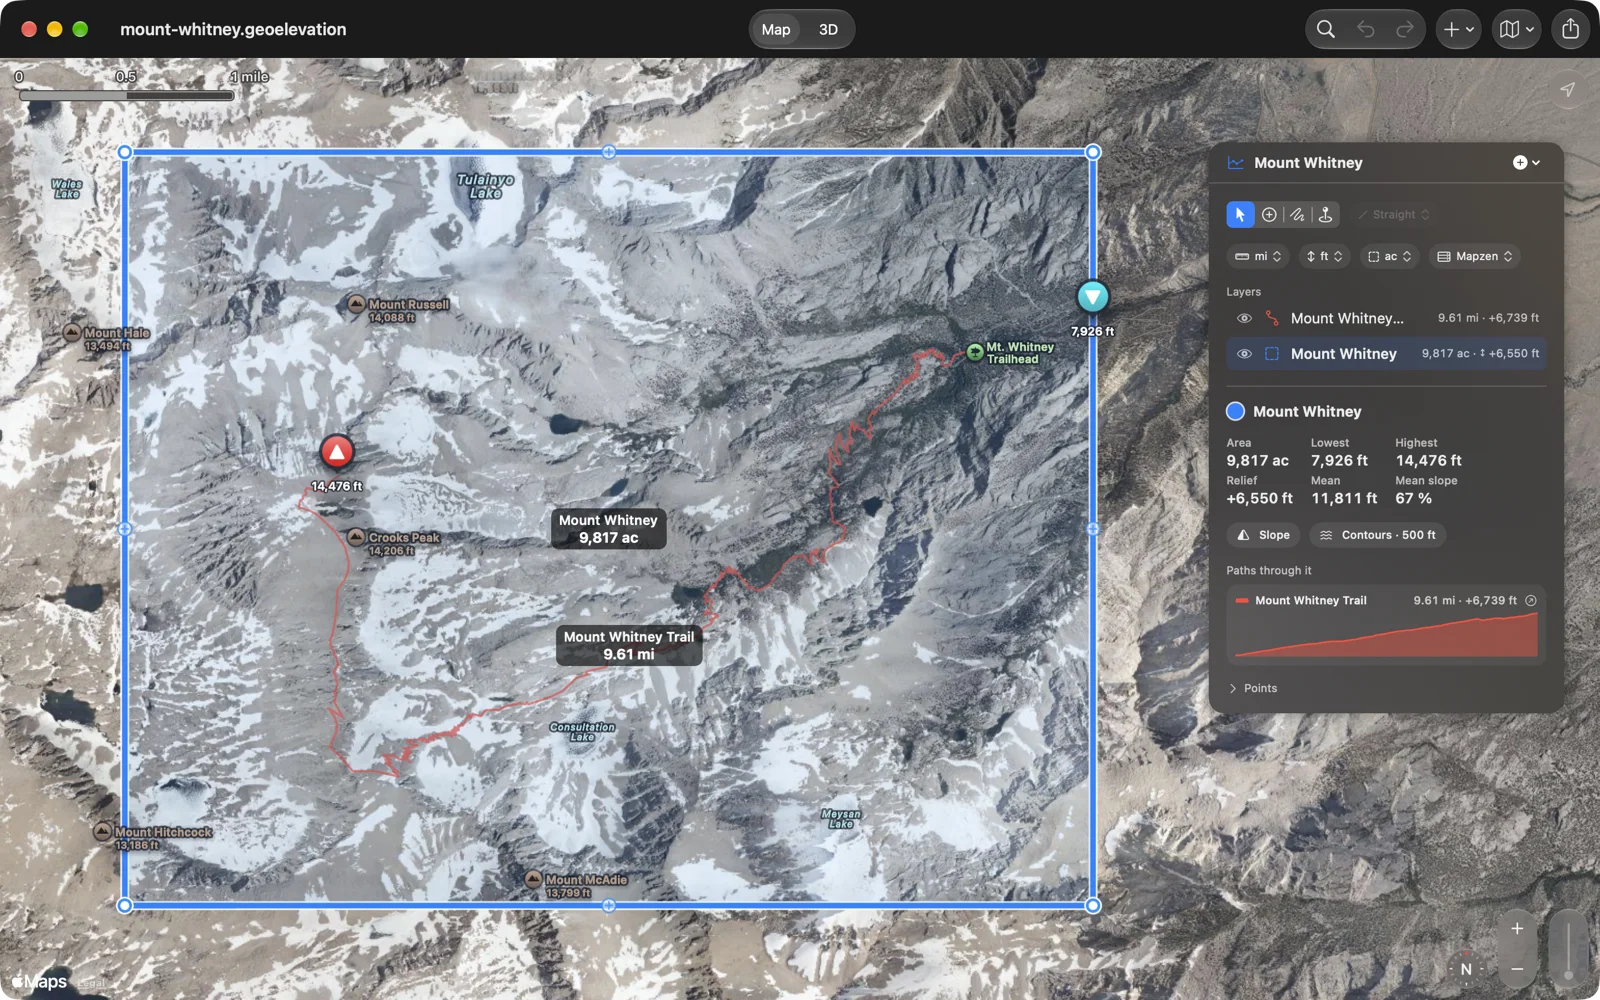
Below sea level, too
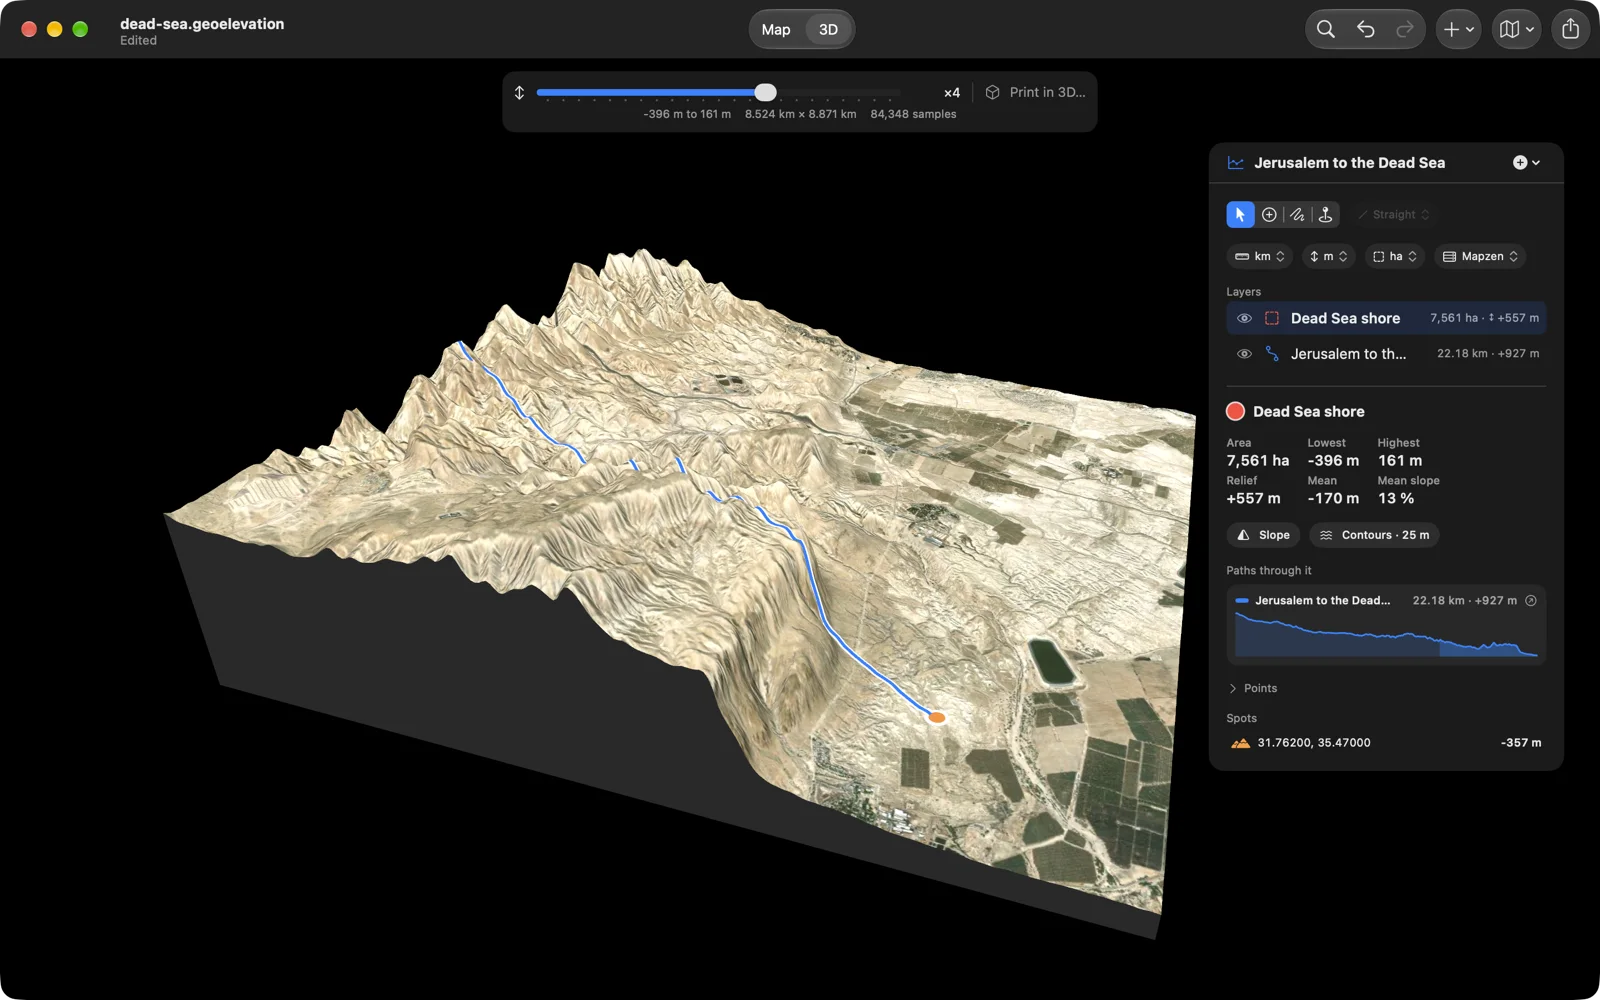
Sea level is a line, and the ground below it shows as it is: the road from Jerusalem ends 357 meters below the line at the Dead Sea, the shore around it reaches 396, and the basin stands in 3D as a trench. Below the line, the sea is told from dry land by OpenStreetMap’s coastline, so Death Valley reads as ground and the seabed as sea.
On paper, or in plastic
Print the page you need: the map or the 3D view as you turned it, with the slope and the contours if you want them, the profile, the numbers, the points; a preview shows the page while you choose. The print sheet and the PDF report carry a sharp profile with its units, tables with headings and page numbers, and a path’s line of sight with its verdict. Or save the ground as an STL file for a 3D printer, cut to the area’s outline, on a flat base, with the trails raised on it.
Layers, like a drawing app
Paths, areas, circles and rectangles live in one document as layers, each in its own color: show them, hide them, drag them into order. Select moves what is there and never adds a point; Add Points draws; Freehand traces an edge. Every step is undoable.
Spot heights and every point
Pick any point for the height of the ground there. The panel lists every point of a path with its coordinates, in decimal degrees or in degrees, minutes and seconds, its height, and the leg to the next one.
In and out
Import a GPX track from a watch, a KML route from Google Earth, GeoJSON from a GIS, or a file from the older Geo Elevation for Mac. Export GPX with elevations, CSV, GeoJSON, an image of the map and the chart, or a PDF report. The document itself is GeoJSON; its icon draws the ground it carries, and Quick Look shows its map and profile in the Finder and in Files.
Your units, your map
Kilometers or miles, meters or feet, hectares or acres: each document remembers its own, so the Alps stay in meters while Yosemite stays in feet. Standard, satellite, hybrid and 3D map styles. Files live in Files and iCloud Drive, so the trail you sketched on the phone opens on the Mac.
Made for the Mac
Documents open in windows, autosave and keep versions, and a welcome window offers a new profile, a file, the sample and your recent documents. The menu bar has the whole app in it: ⇧⌘1 and ⇧⌘2 switch between the map and 3D, ⌃⌘1 to ⌃⌘4 pick Select, Add Points, Freehand and Spot, ⌥⌘S and ⌥⌘C show the slope and the contours, ⌘E fetches the heights, ⌥⌘P prints in 3D, ⌘F searches for a place, ⌘0 fits the map, ⌘, opens the settings. In Look, W A S D or the arrow keys walk, Shift runs, Q and E turn, drag to look, click to go there, Esc to leave. Drop a GPX, KML or GeoJSON file on the map to import it.
On iPhone, iPad and Vision Pro
The same app and the same file. On the phone the map fills the screen and a card at the bottom carries the numbers, the layers and the profiles; in Look, drag to look around and tap to go. On the iPad and on Apple Vision Pro the panel sits beside the map, and the terrain is something you turn in front of you.
No file handy? Try these
Real documents, free to use. Download one and open it with Geo Elevation.
- Glacier Point: a five-mile circle around the overlook in Yosemite; turn on View from Center, then Look toward Half Dome.
- Charlotte to Mount Mitchell: 86 miles in a straight line, with its line of sight over the curve of the Earth.
- Mount Washington: the summit area with the Tuckerman Ravine Trail on foot and the Auto Road by car.
- Mount Fuji: the cone in a circle, with the Yoshida Trail to the crater.
- Half Dome: the dome and Little Yosemite Valley, with the Mist Trail and the John Muir Trail.
- Mount Whitney: the highest summit in the lower 48, with the Mount Whitney Trail from the Portal.
- Jerusalem to the Dead Sea: a road down to 357 meters below sea level, and the shore around it.
Yours stays yours
Geo Elevation has no account and no tracking. Your documents are files on your device, and in your iCloud Drive if you put them there. What leaves the device: the coordinates you ask about, sent to our own elevation server for the heights, the view from a point and the coastline (ASTER and Mapzen data at 30 meters, worldwide), the map tiles, imagery and routes Apple Maps provides, and the place search you type. One purchase, no subscription, no in-app purchases. In English, German, French, Spanish and Japanese.
Questions people ask
Can I see one place from another? Draw a straight path of two points, from where you stand to what you want to see, and turn on Line of Sight with the binoculars beside the chart. The app lifts the ground by the curve of the Earth, with the usual allowance for the air bending light, and draws the line from your eye to the far end. Green means in sight, orange means the ground is in the way, and the dot marks where. The binoculars also set the height of your eye and of the target.
What is a viewshed? The ground that can be seen from one point. Draw a circle around the point and turn on View from Center: what the center sees is green, what the terrain hides is red, out to the edge of the circle, and the panel gives the area and the share in view. Choose Look to stand there and see it for yourself.
How do I get the elevation profile of a trail? Choose Add Points and Walking, then add the points of the trail in order: the start, a junction or two, the summit. Each leg follows the path and the profile appears after the second point.
How do I see the slope of an area? Draw an area, a circle or a rectangle around it and switch on Slope. The bands start at the angle chosen in Settings (25 degrees unless you change it), and the legend gives the share of the area in each.
How accurate is it? The heights come from ASTER and Mapzen, global elevation models with one value every 30 meters. Profiles and areas are sampled at that spacing, so nothing between the samples is invented. It is a model of the ground, not a survey: expect a few meters either way, more on cliffs and in cities, and treat slope bands as a planning aid, never as an avalanche forecast. Line of sight and the view from a point see the ground as the model has it; a forest or a building can still be in the way, and haze decides the rest.
Can I 3D print the terrain? Yes. In 3D, choose Print in 3D and save an STL: the ground inside the area on a flat base, with the size, the base and the height stretch you pick, and the paths raised on it if you like.
Can I import a track from my watch? Yes. Import GPX, KML and GeoJSON; the app samples the ground along it, draws the profile, and exports the same track back out with elevations.
Does it work without a connection? Editing does; fetching heights, the view from a point, routes and new map tiles needs one.
Is there a web version? Yes, Geo Elevation on geosq.com draws the profile of a path in any browser, free, and geosq.com has slope and contour maps too. The apps add documents, areas, line of sight over the curve of the Earth, the terrain in 3D, routing, printing and the Mac menus.
What is Geo Elevation for Mac? The same app, sold on its own Mac-only record since 2016, with the same features and the same updates, for people who only want the Mac app or already own it. The app on this page is one purchase for iPhone, iPad, Mac and Vision Pro. Nobody needs both.
How much is it? One price, paid once, for all four platforms; the App Store shows it in your currency. No account, no subscription, no in-app purchases.
What changed lately? Line of sight, the view from any point and Look are written up in the 2.3 post; shapes, the ground inside areas, slope and contours, routing and printing in the 2.1 post.
Is there a manual? The Geo Elevation guide covers every tool, layer, setting and Mac shortcut; it is also what the app’s Help menu opens.