Seismica 1.2: replay a great earthquake, and keep a study with your own notes
Seismica began as a globe: the latest USGS earthquakes as markers, the world’s active faults drawn under them, a list beside the map. It is a good way to look at today. This version is about the two things a globe of today cannot do: show how an earthquake unfolds over time, and let you keep what you found.
Watch it unfold
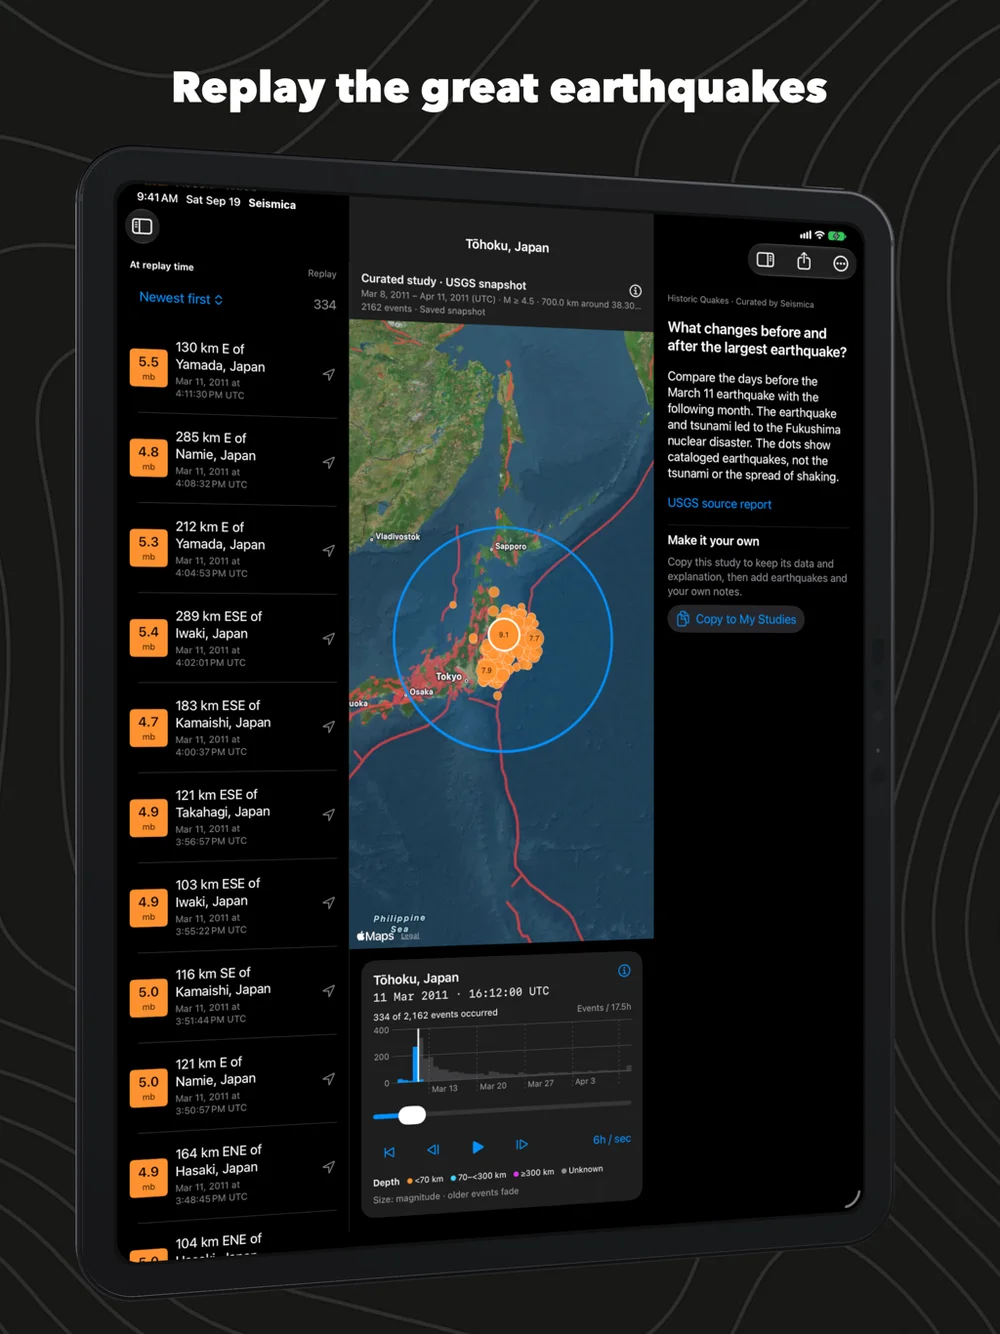
A catalog is a list, and a list hides the most interesting thing about a great earthquake, which is time. So Seismica now plays a sequence on the map. Four are built in: Tōhoku 2011, Sumatra–Andaman 2004, Ridgecrest 2019 and Türkiye–Syria 2023, each with the catalogued events around it, a short explanation of what to look for, and its USGS source.
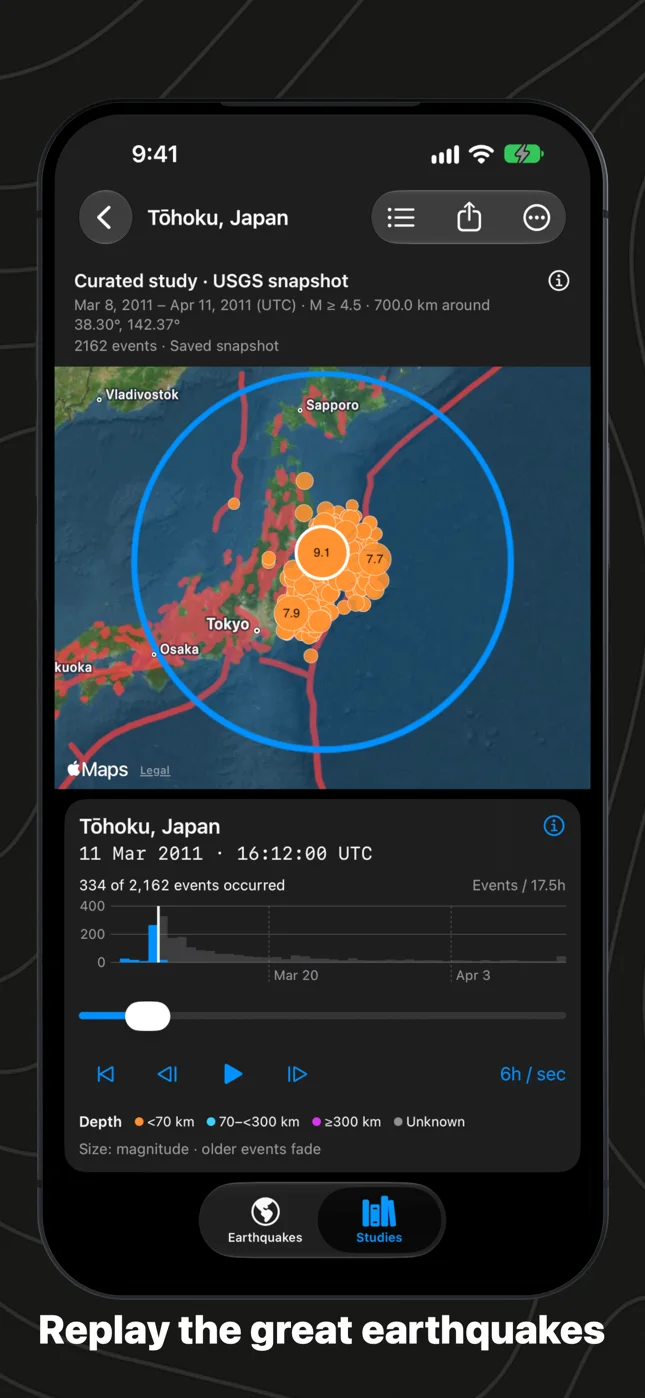
Tōhoku is the one I keep going back to. The replay starts on March 8. For three days there are 53 earthquakes of magnitude 4.5 or more off the coast, one of them a 7.3 on March 9 that would have been the story of the year anywhere else. Then the 9.1, with a 7.9 and a 7.7 inside the next forty minutes and 527 earthquakes in the first day. Over the following month the count passes two thousand, and you can watch them trace the plate boundary and slowly thin out. None of that is new science. Seeing it happen on a map, at six hours a second, is a different thing from reading it.
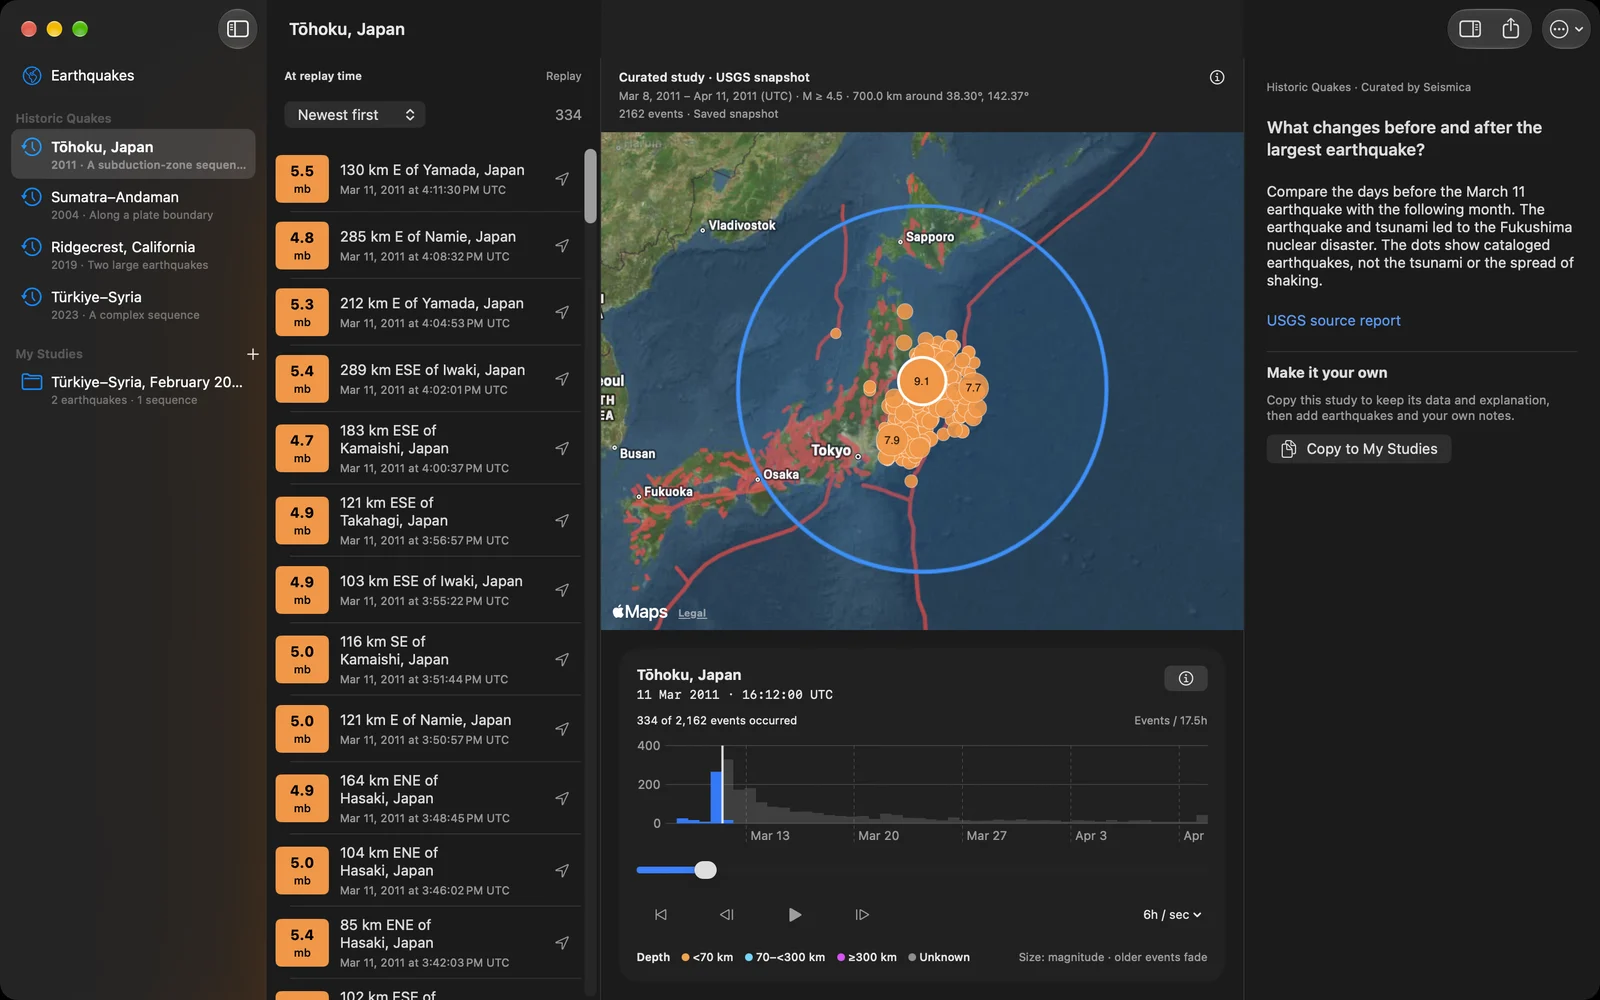
Dots are sized by magnitude and coloured by depth, older ones fade, and the chart under the map shows where in the sequence you are. You can also step event by event. And it is not limited to the four: open any earthquake, choose Explore sequence, and Seismica fetches what happened around it, before and after, and plays that.
One caution, which the app repeats where it matters: the dots are catalogued earthquakes. They are not the tsunami, not the spread of shaking, and an earthquake near a mapped fault is not proof of which fault moved.
Search the part of the world you care about
You can search for a place, use the part of the map in front of you, or give a centre and a radius, over the past day, week or thirty days or between any two dates. The searched area is outlined on the map. Every result says where it came from, when it was retrieved and whether it hit the limit of 1,000 events, so a big search never quietly looks complete.
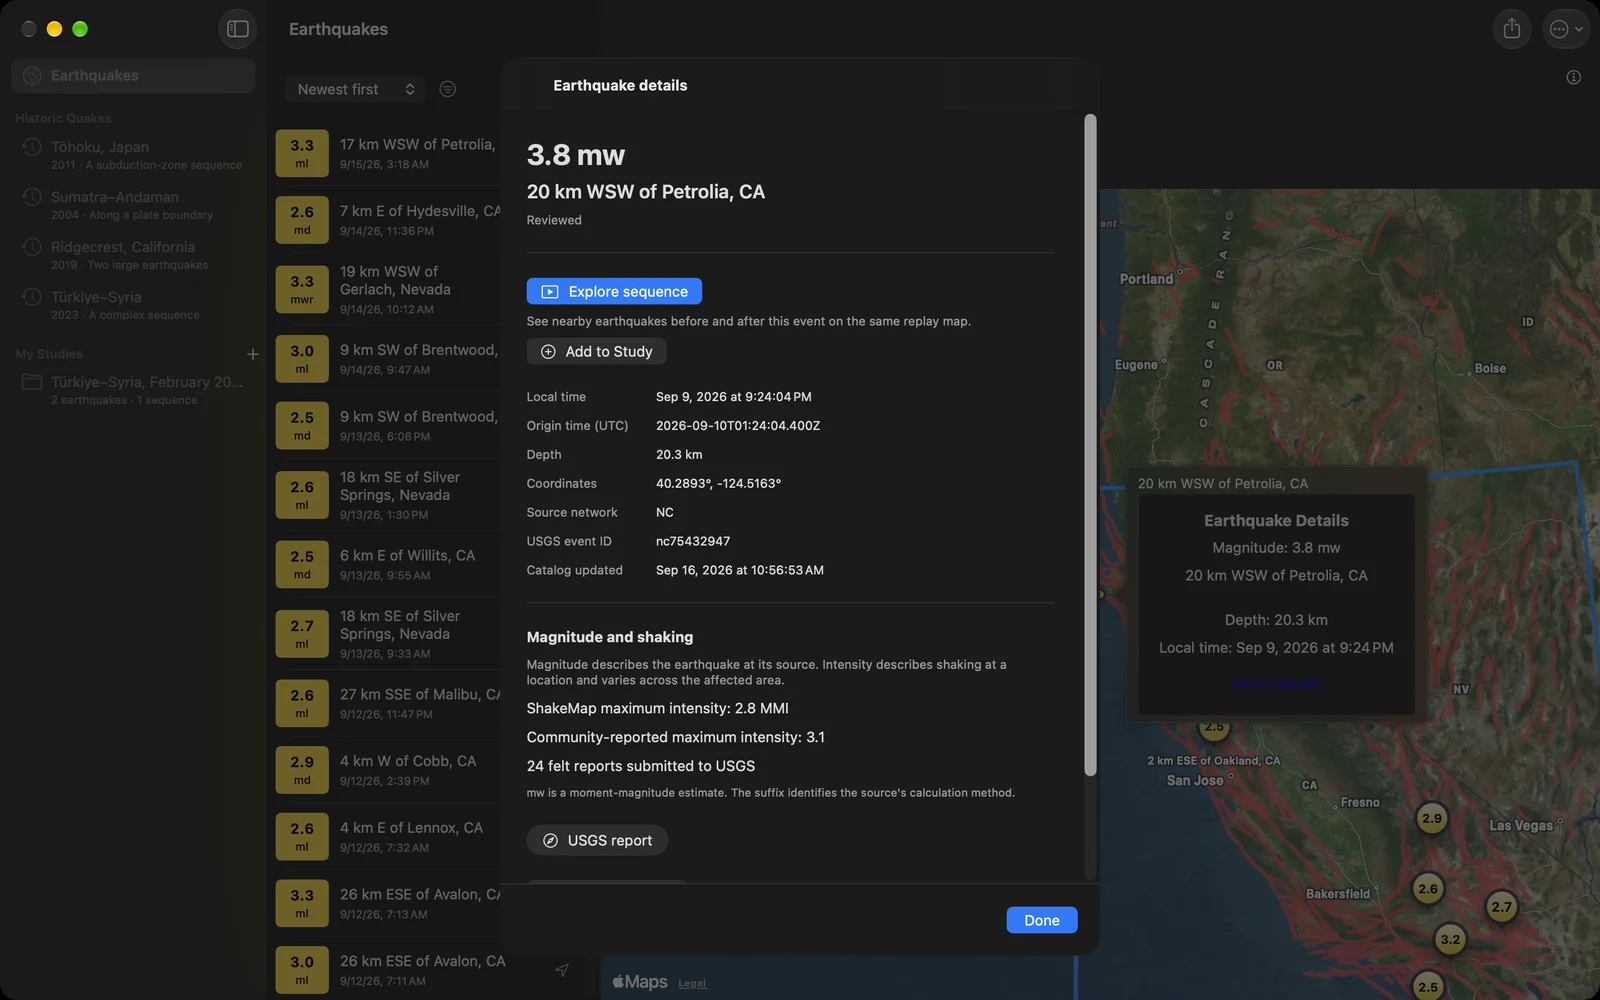
The event view is native now, and it keeps magnitude and shaking apart, because they answer different questions: the magnitude with its scale, depth, local time and UTC, review status, and the ShakeMap, community intensity and felt reports where the USGS has them. The full USGS report still opens inside the app.
Keep a study
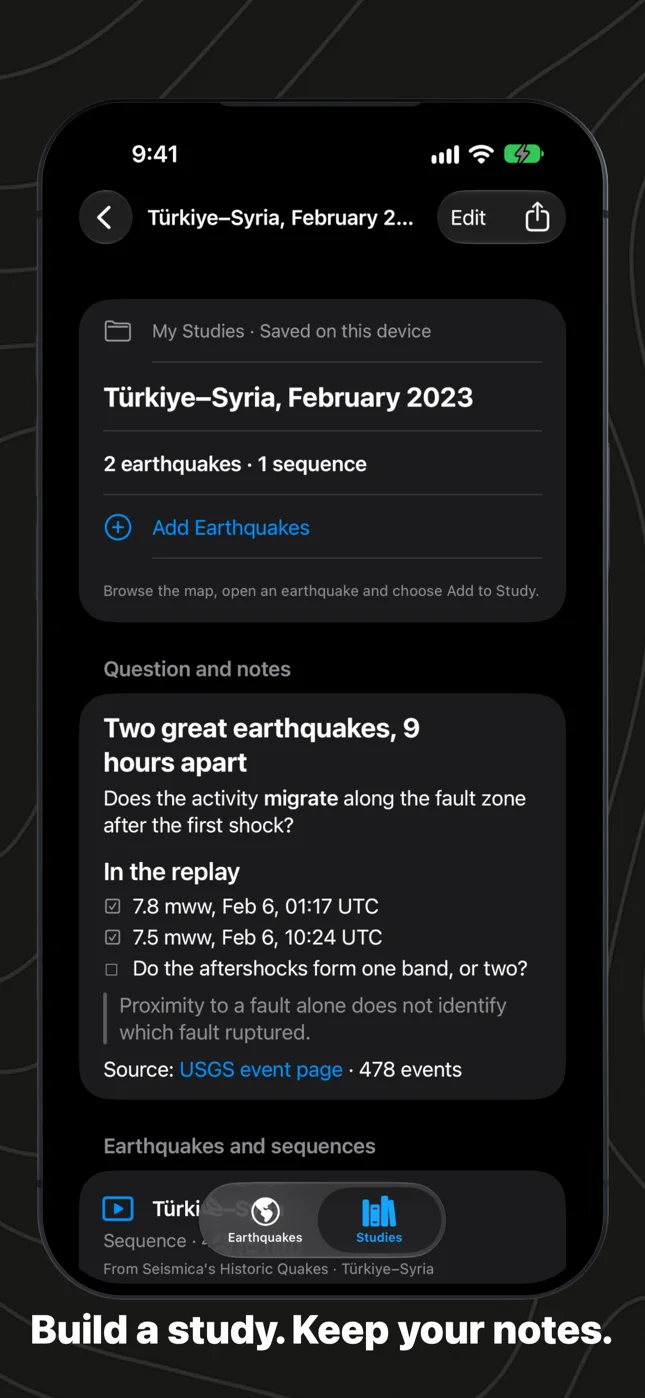
This is the part I expect to use most. A study is a folder for a question. Add single earthquakes, whole searches and replay sequences to it, or start from a copy of one of the historic earthquakes. Each item keeps a frozen copy of its records, so the study reads the same next month and opens without a connection, and you can still run the search again when you want today’s catalog.
Notes sit beside the evidence, and they are Markdown: headings, lists, checkboxes, quotes, links, tables and pictures. They save as you type. On the Mac and iPad every study is in the sidebar, one click away.
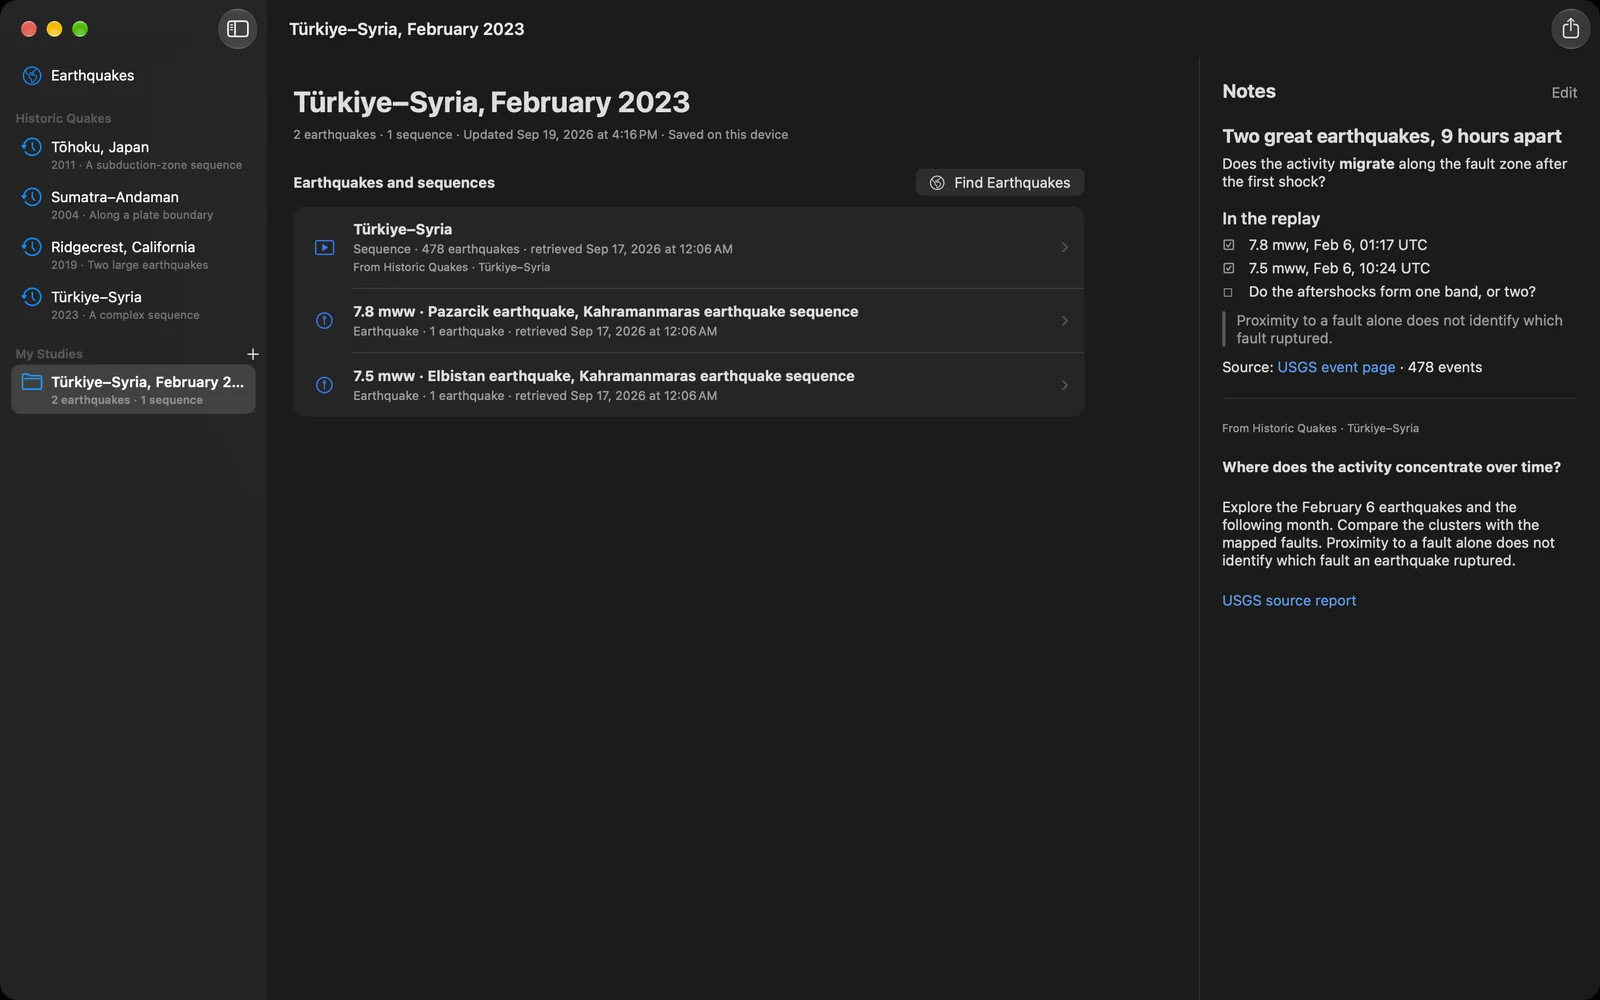
A whole study, notes included, exports as one .seismica file named after the study. AirDrop it or mail it, and it opens in Seismica on the other device with every record and source in place. CSV and GeoJSON exports are there for spreadsheets and mapping tools. The study in the picture is on the product page as a download, if you want to try one.
Smaller things
A measurement the catalog does not have now stays unknown; it used to become a zero. Magnitude labels use the scale the source reported. A refresh keeps your place on the map, and one that fails leaves the earlier results on screen and says so. The Mac has a proper menu bar, with shortcuts for starting, importing and exporting a study and for showing the notes.
Seismica shows published earthquake information. It does not predict earthquakes and it is not a warning service. It is free on iPhone, iPad and Mac, with no ads and no account, and the product page has the rest.