Make a race-day map in KML: the course, water, medical and parking, layer by layer
A charity 5K needs more than a route. The volunteers need to know where the start corral ends, which corner the water table goes on, how much room the medical tent wants kept clear, and where people park. That is one map with several layers, and the format that carries layers from one app to the next is KML: Google Earth opens it, phones open it, a GIS opens it, and it is a plain text file you can email.
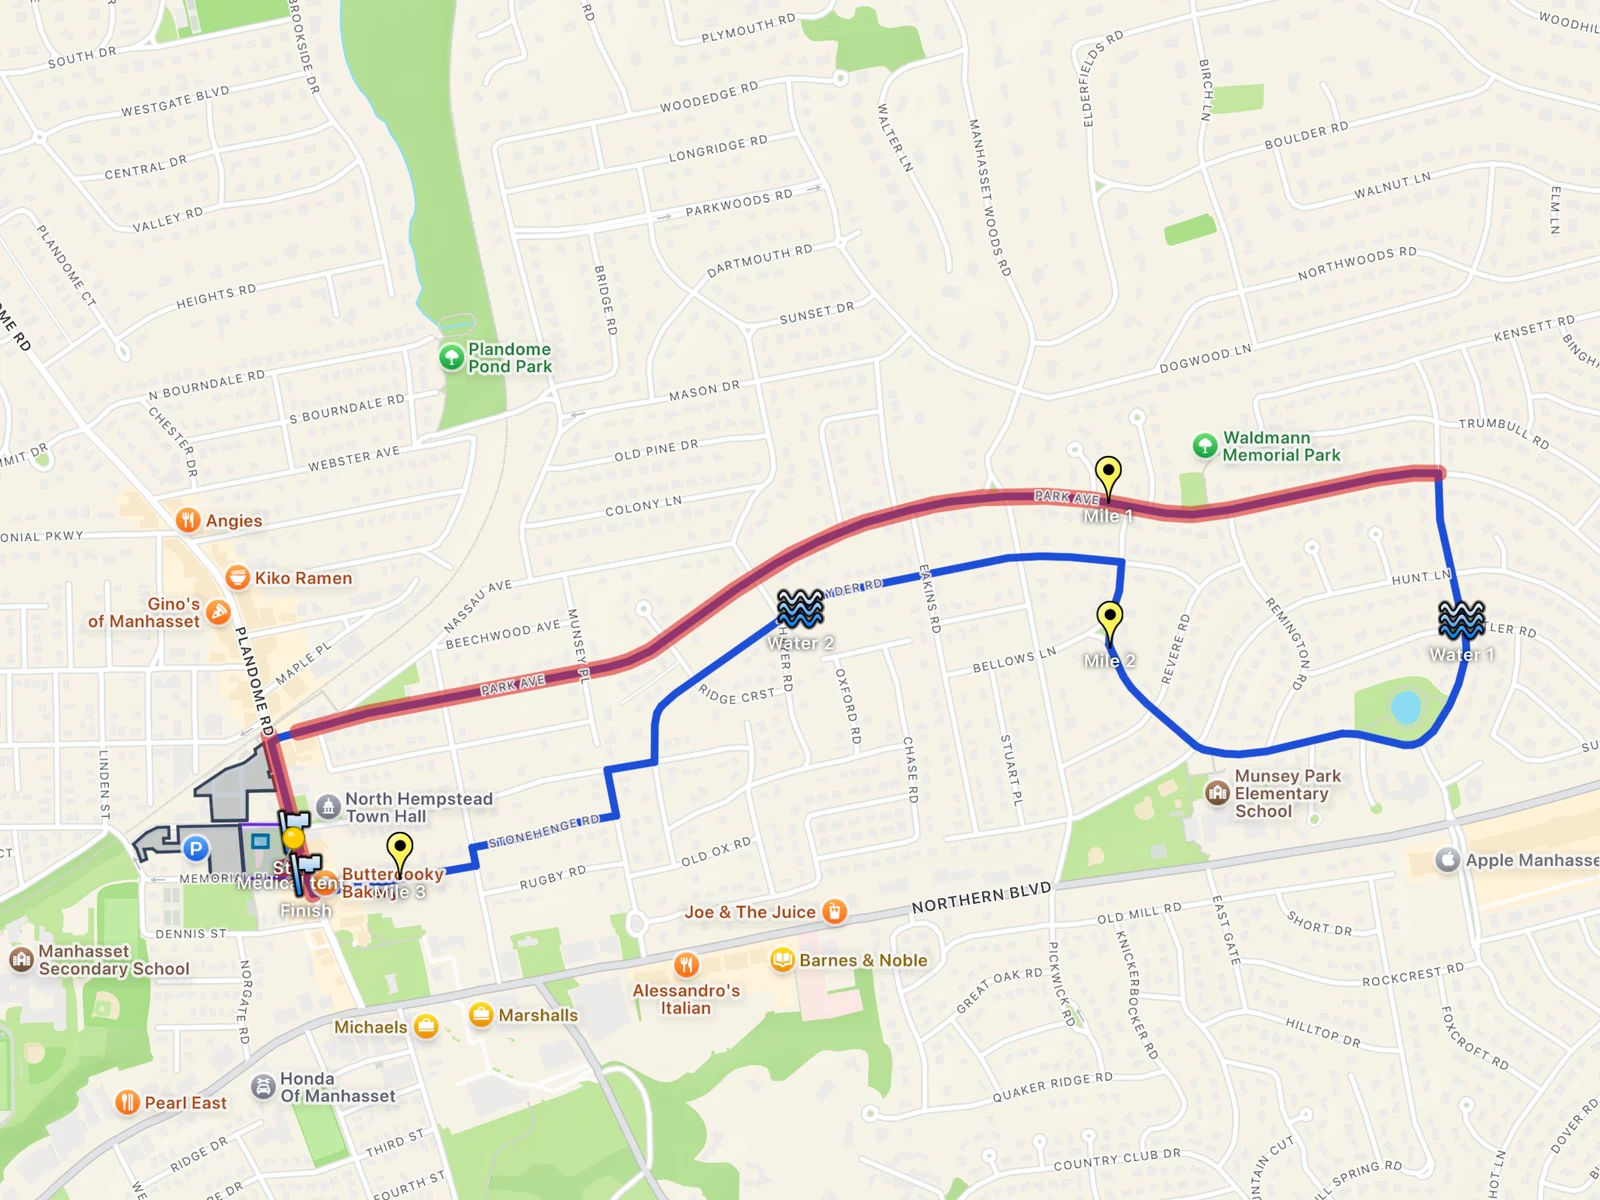
This guide builds that map for a charity 5K like the Manhasset Women’s Coalition Against Breast Cancer run, which starts at Mary Jane Davies Green, the park on Plandome Road in Manhasset, every October. The course below is our own example on the streets around that park, made to show the steps. It is not the race’s course and we have no connection with the race; for the real course, use the organizer’s map.
Everything here works in KML Explore on the Mac, iPhone and iPad. Opening and looking at a map is free; drawing and changing one needs KML Explore Pro. Download the finished map to follow along or to start yours from it.
The plan: one folder for each kind of thing
Before you draw anything, decide on the folders. Each one is a layer a volunteer can switch on and off, and each answers one question:
- Course: the line runners follow.
- Start and finish: both lines, the start corral and the finish chute.
- Mile markers and Water: where the signs and the tables go.
- Medical: the area kept clear around the tent.
- Runner village: the green, with bag check.
- Parking and Closures: the lots, and the streets that close.
Pick the course before you open the app, too. A good one for a road race stays on one side of every highway and railroad. This one never touches Northern Boulevard and never crosses the Long Island Rail Road tracks by the station; it stays on the residential streets between them.
Start a new map
Choose New Map in the welcome window on the Mac, or on the start screen on iPhone and iPad. A new map opens ready to edit, with the edit bar over the map; press Edit (the pencil in the toolbar, or Draw ▸ Edit, ⌥⌘E on the Mac) only when you open a map that already exists, like the one you can download above. Select the top row of the layer list and type the event’s name in the inspector’s Name field.
Now make the folders. New Folder is in the edit bar’s + menu, in Draw ▸ New Folder (⇧⌘N) on the Mac, and in the menu you get by right-clicking a row (touch and hold on iPhone and iPad). A new folder goes inside the selected folder, so select the top row before each one, then rename it. Anything you draw goes into the selected folder, or right after the selected placemark, so select a folder first and its contents land in it. A row dragged onto a folder moves into it.
Draw the course along the streets
Select the Course folder, choose the Path tool (⌃⌘3 on the Mac) and set the edit bar’s lines to Follow Paths (Walking). Click where the race starts, then click where the course goes next. You don’t trace the streets: each click asks Apple Maps for the walking route from the last point, and the leg follows the street around its bends.
Give each leg time. While Apple Maps works it out, the leg is dashed and the line under the edit bar says Finding the way…. Clicks you make meanwhile wait their turn, but ending the path, or picking another tool, while a leg is still dashed throws away that leg and the clicks waiting behind it. So wait until the dashed leg is drawn and Finding the way… is gone, then press Return, the ✓ in the edit bar, or Draw ▸ End Path or Area.
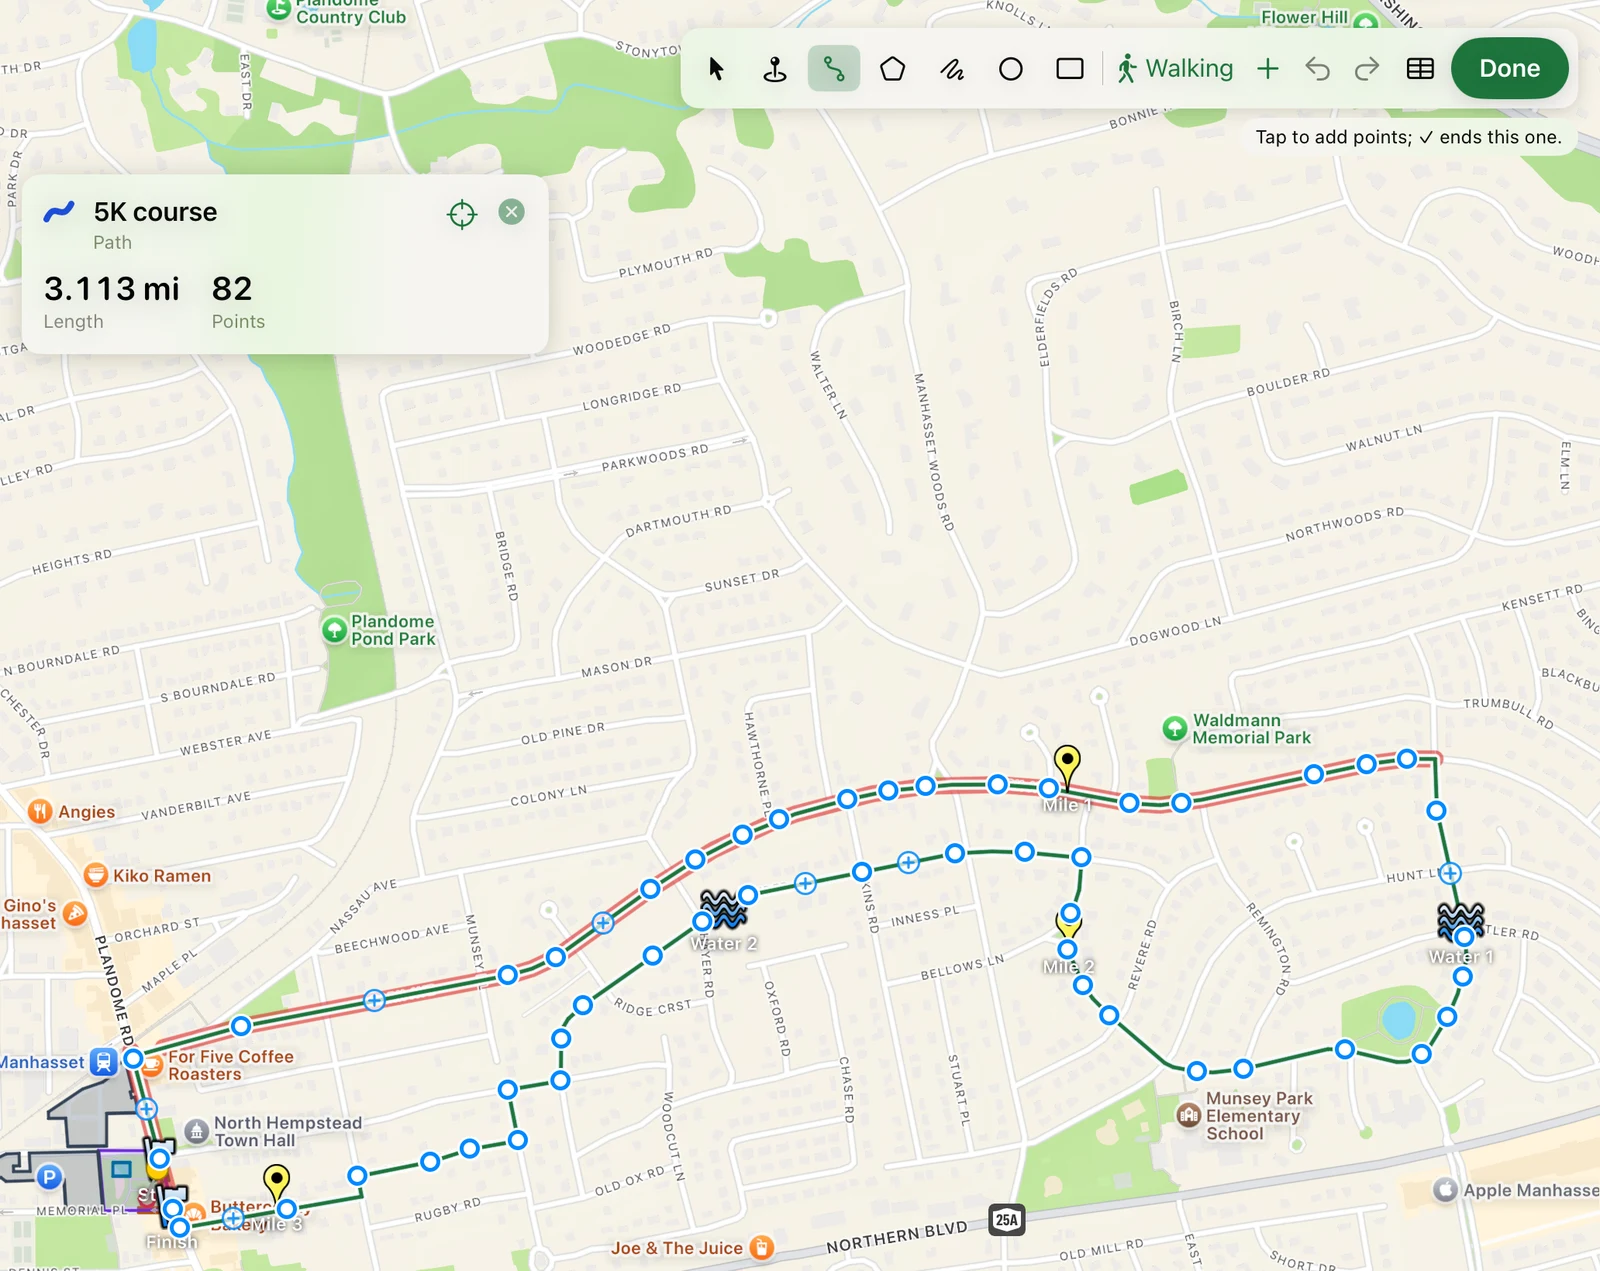
The card over the map shows the length of what you have drawn, once each leg lands. To make the course come out at 5 km, click where you think the last stretch should go, wait for the leg, read the length, and if it is long or short, Undo and click somewhere else. The loop here took 14 clicks and measures 3.113 miles.
With the course selected, the inspector’s Style section has its Line color and Width. A thick blue line reads from across a room on a printed copy.
Start, finish, corral and chute
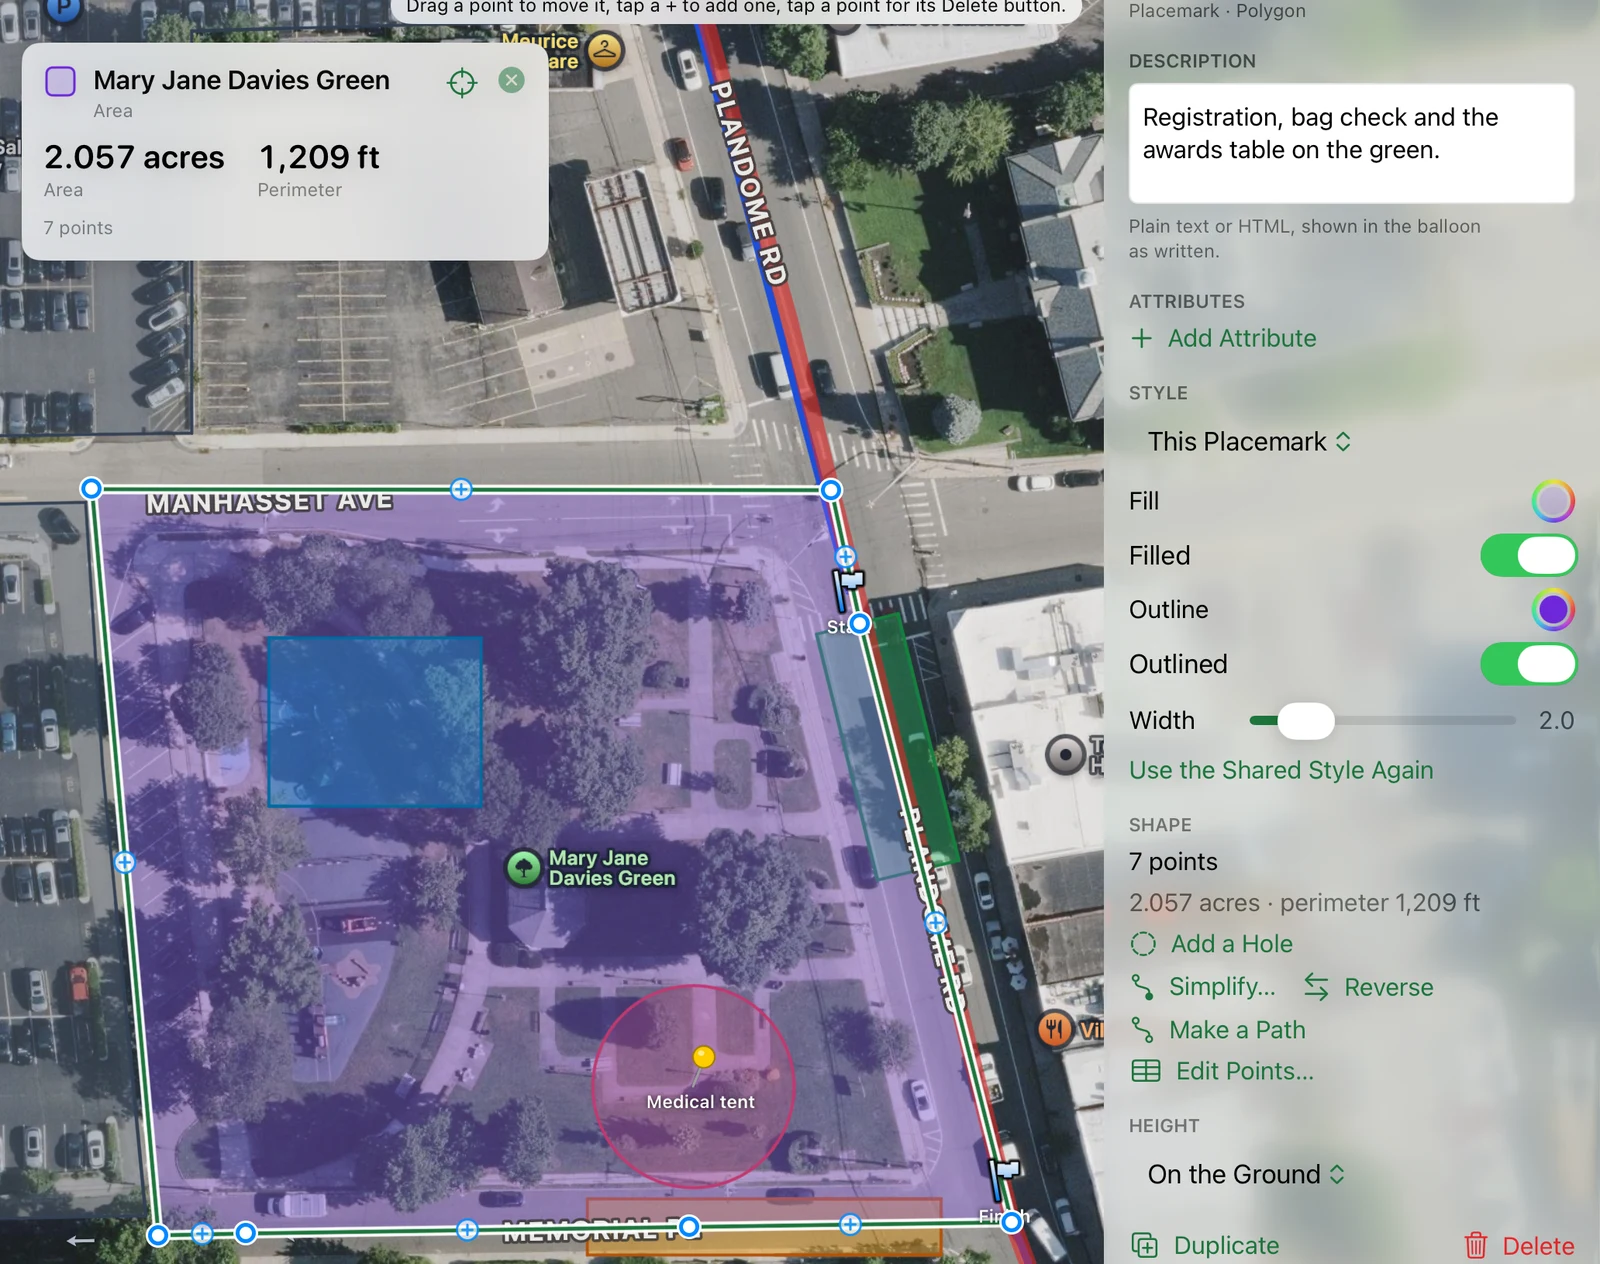
Select the Start and finish folder. Two placemarks mark the lines; choose the Placemark tool (⌃⌘2), click, and in the inspector pick Icon ▸ Shapes ▸ flag. The corral and the chute are areas: choose the Area tool (⌃⌘4), set the lines back to Straight Lines, click the corners, and end it as you end a path. The card shows each area’s size and perimeter, which is how you check a corral has room for the field. For a tent with north-south sides, the Rectangle tool (⌃⌘7) takes two opposite corners.
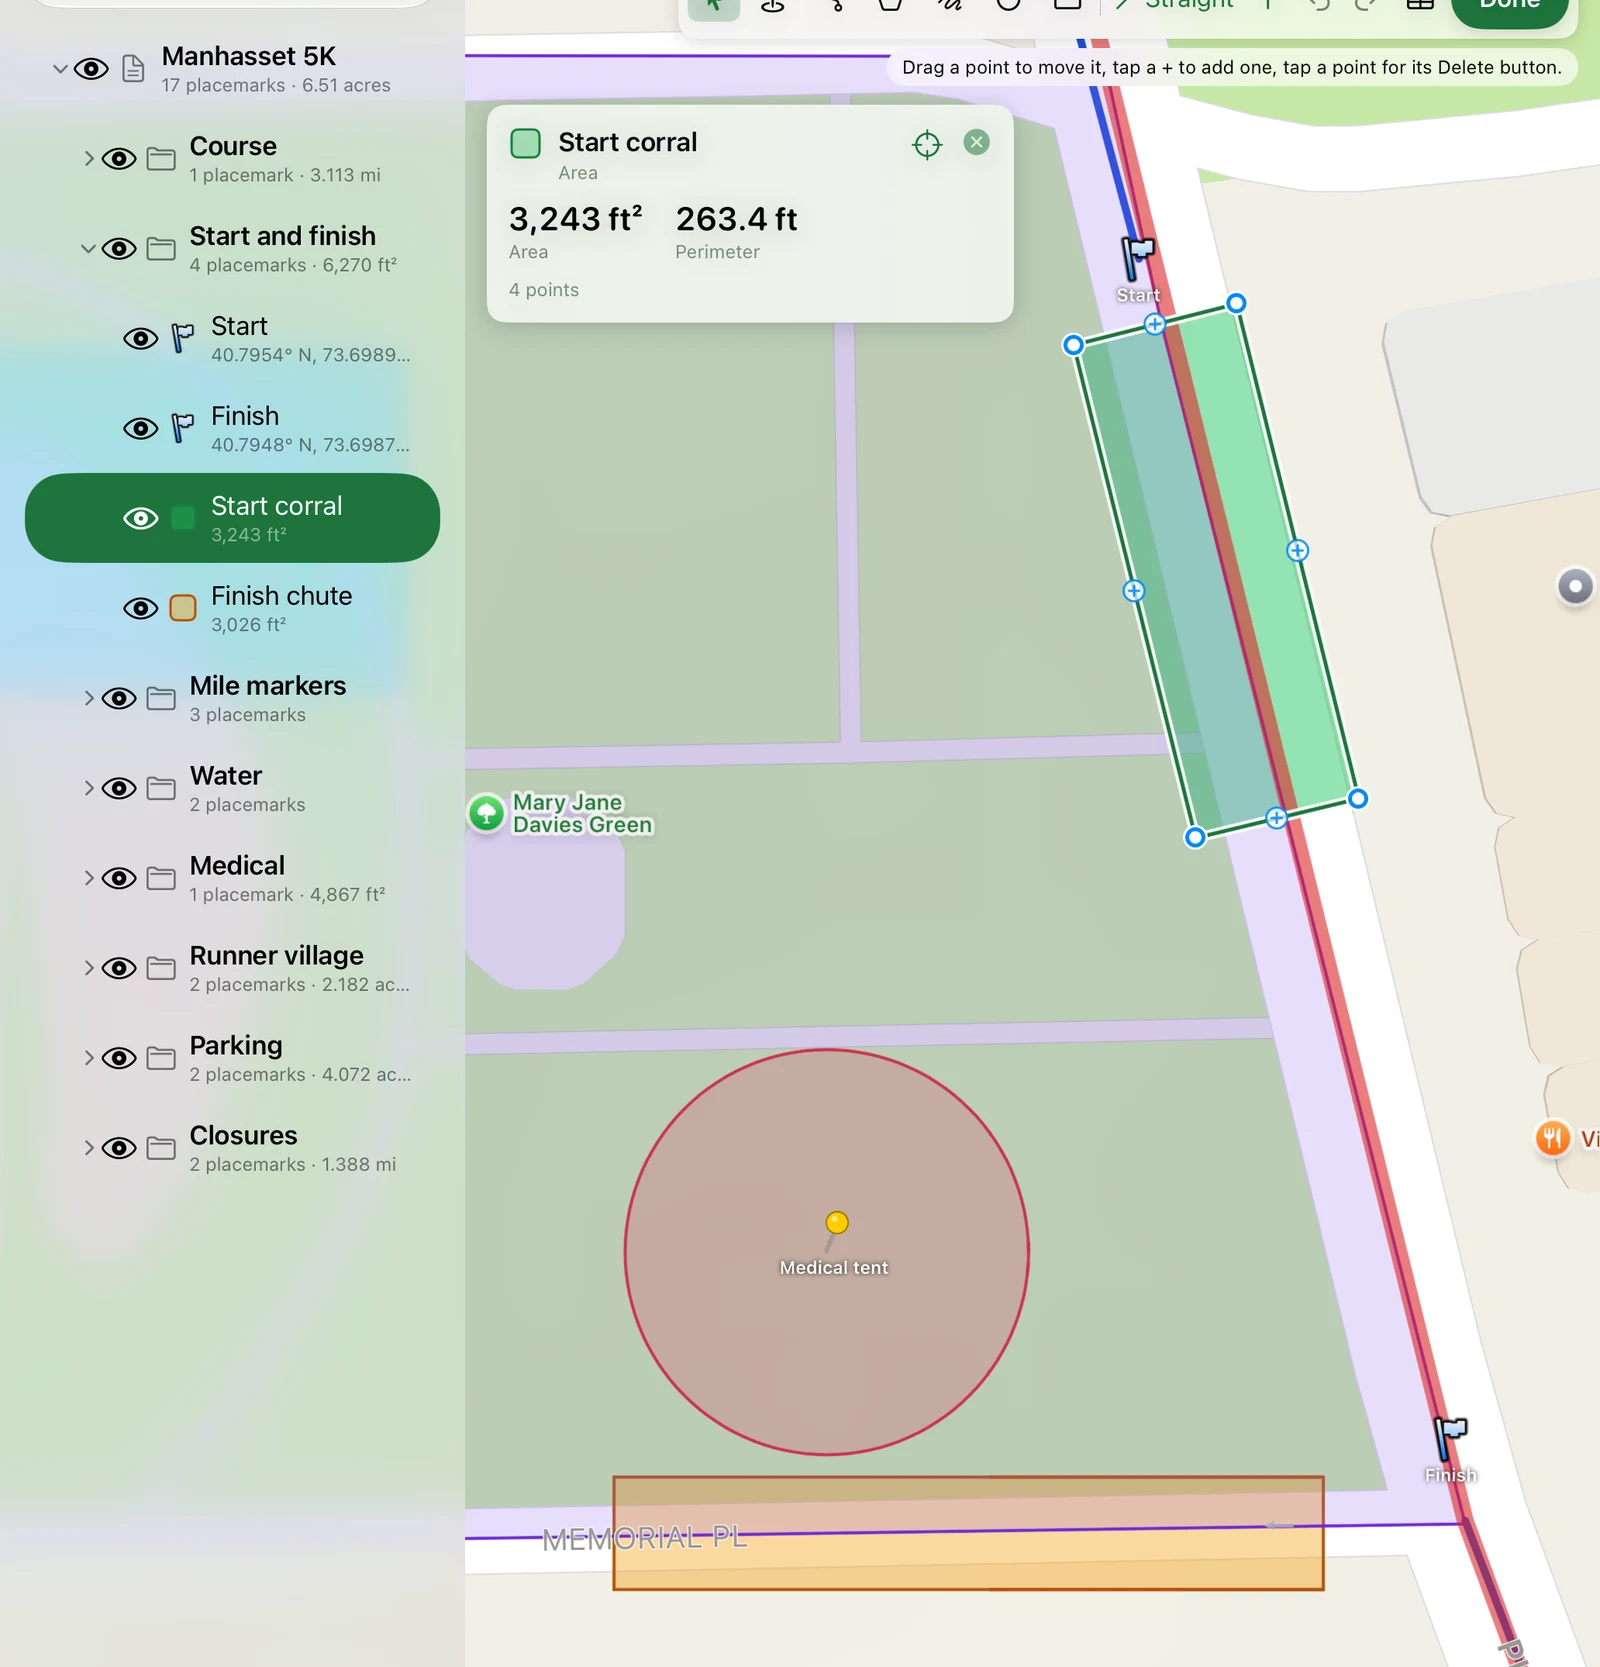
Think about which way runners face. Here the course leaves the start heading north on Plandome Road, so the corral sits south of the start line. The finish is at the green’s south corner, and the chute turns off into Memorial Place, out of the way of runners still coming in.
Water stations and mile markers
Select the Water folder, choose Placemark and click where each table goes. In the inspector, give each one a name and a description. The description is what pops up when someone taps it, so write what a volunteer needs: “On Abbey Road, 2.4 km in.” Under Style, the Icon menu has Google Earth’s pushpins, paddles and shapes; water is under Shapes. Icon color and Icon size are below it.
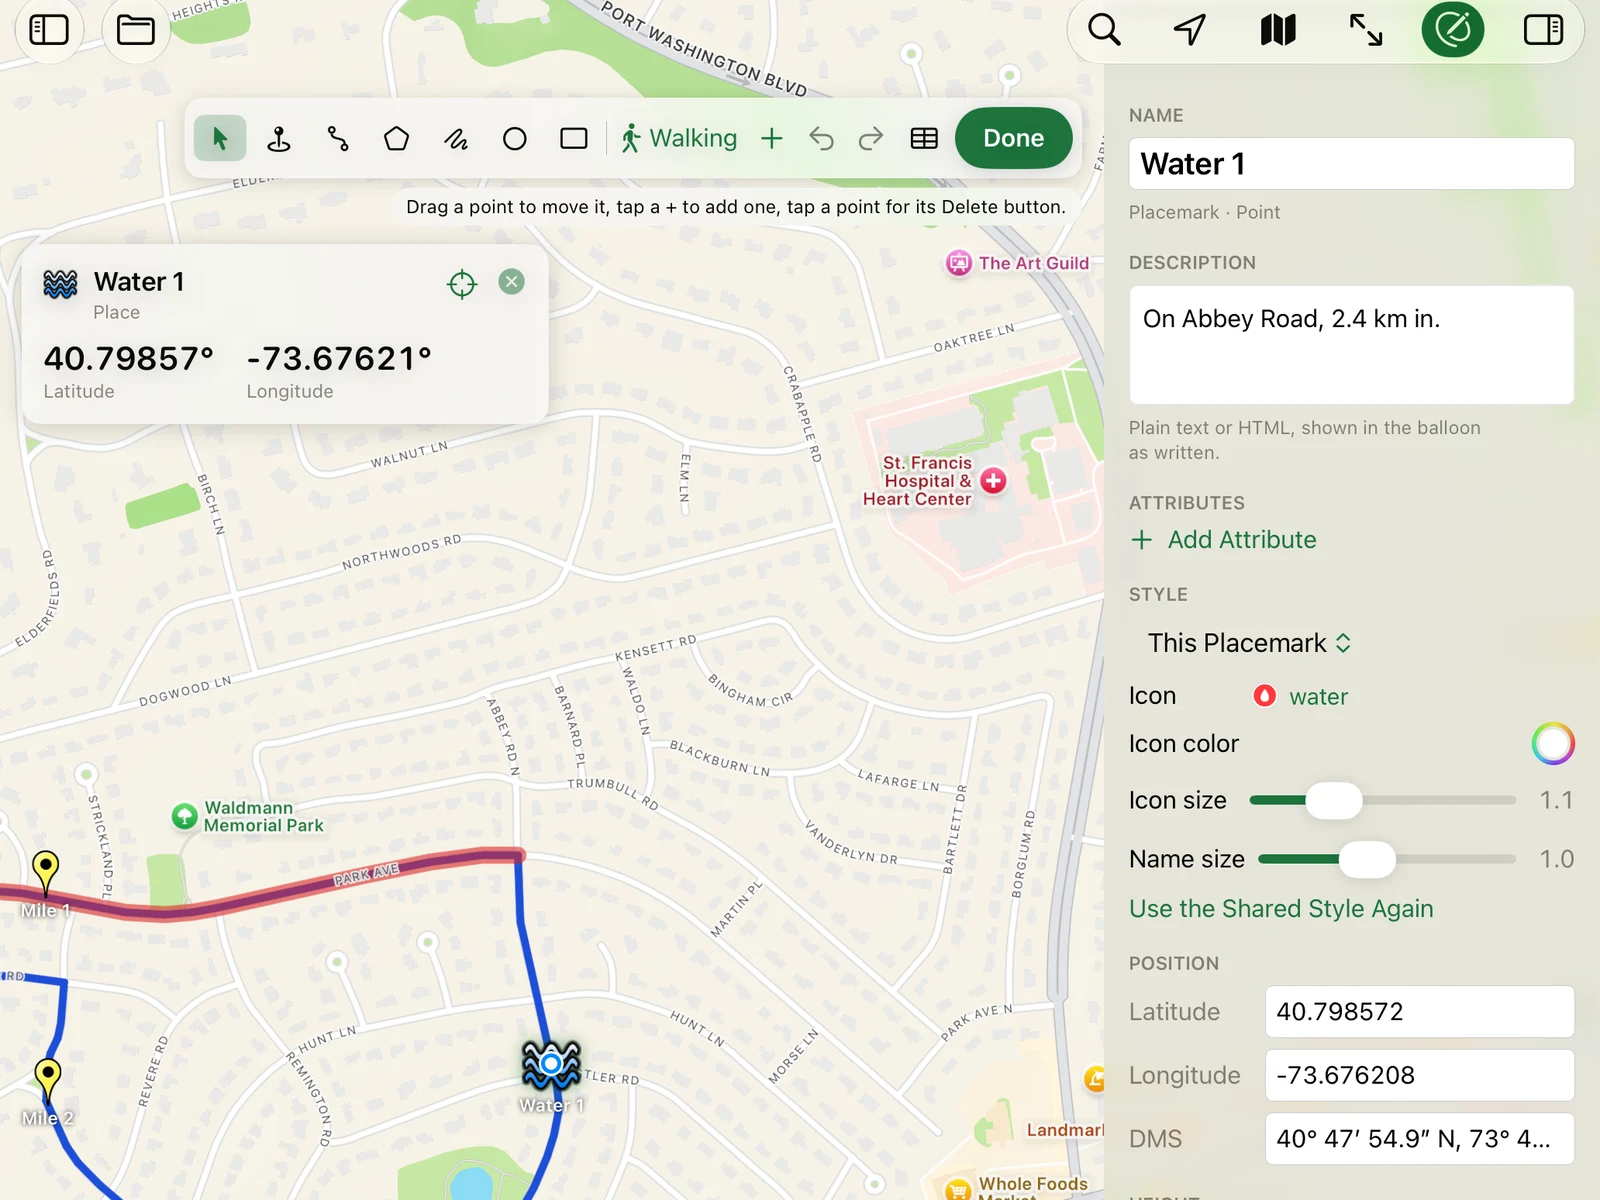
A style change applies to the placemark you selected. Things you draw in KML Explore also share a style, and when a placemark has one, the Changes apply to menu lets you change the shared style instead. Every placemark using it follows the change, except where a placemark has a setting of its own: its own icon or color wins over the shared one. In this map each water station’s icon and each line’s color are the placemark’s own, so change those one at a time.
To find where the mile markers go, select the course and open its points table (the table button in the edit bar,
⌥⌘P on the Mac). On the Mac, or an iPad with room for the full table, the Distance column is the distance along
the line from the start, so the row closest to 1.00 mile is where the first sign goes. On an iPhone the table is a
list that shows each leg on its own, not the distance from the start; there, with no rows selected, choose Copy as
CSV and paste it into Numbers: its distance_m column is the distance from the start in meters (a mile is 1,609 m).
Put a placemark at that row, or type its latitude and longitude into a placemark’s Position fields.
A circle around the medical tent
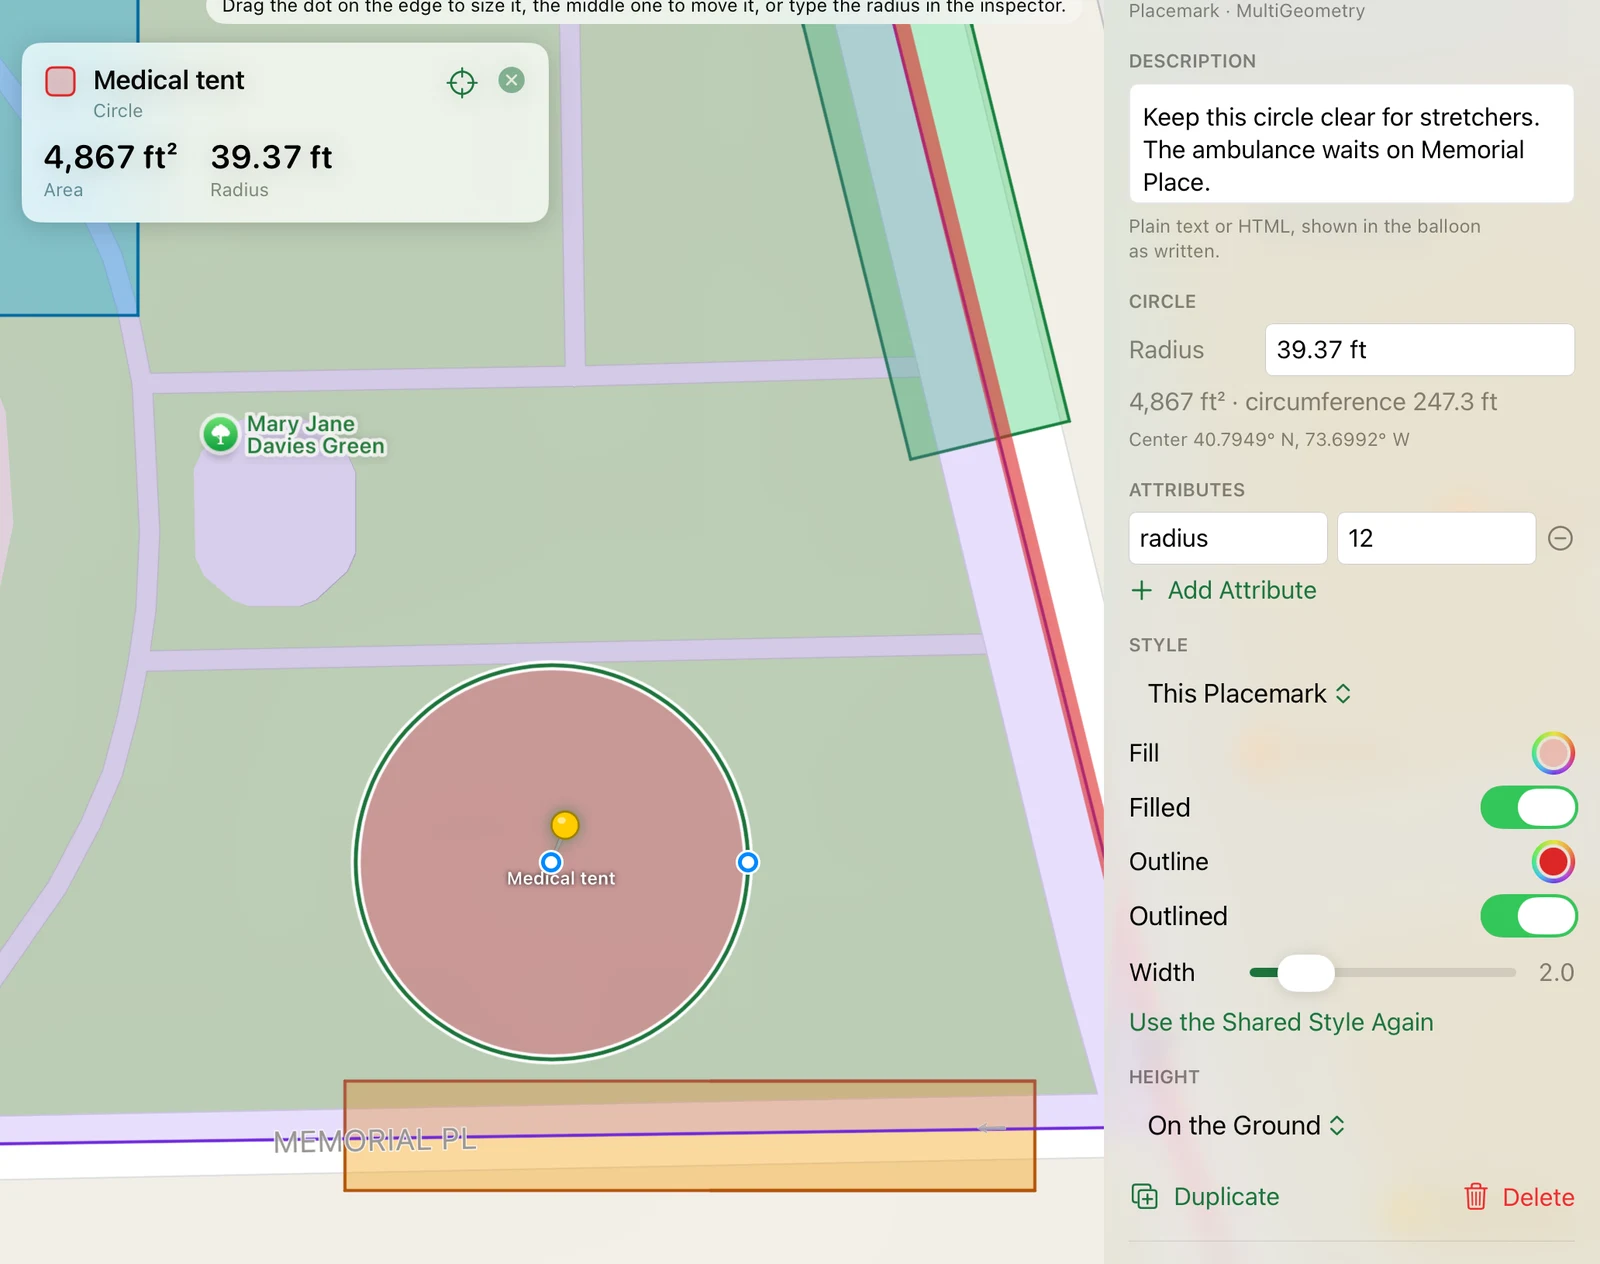
KML has no circle, but KML Explore draws one. Choose the Circle tool (⌃⌘6) and click where the tent goes; the
circle starts at a size you can see. Type the radius into the inspector’s Circle section (12 m, 40 ft), or
drag the dot on its edge. The file stores the center as a point and the outline as an area of 120 points at that
radius, with the radius as an attribute, so Google Earth shows a round area with a pin and KML Explore still edits
it as a circle.
The runner village
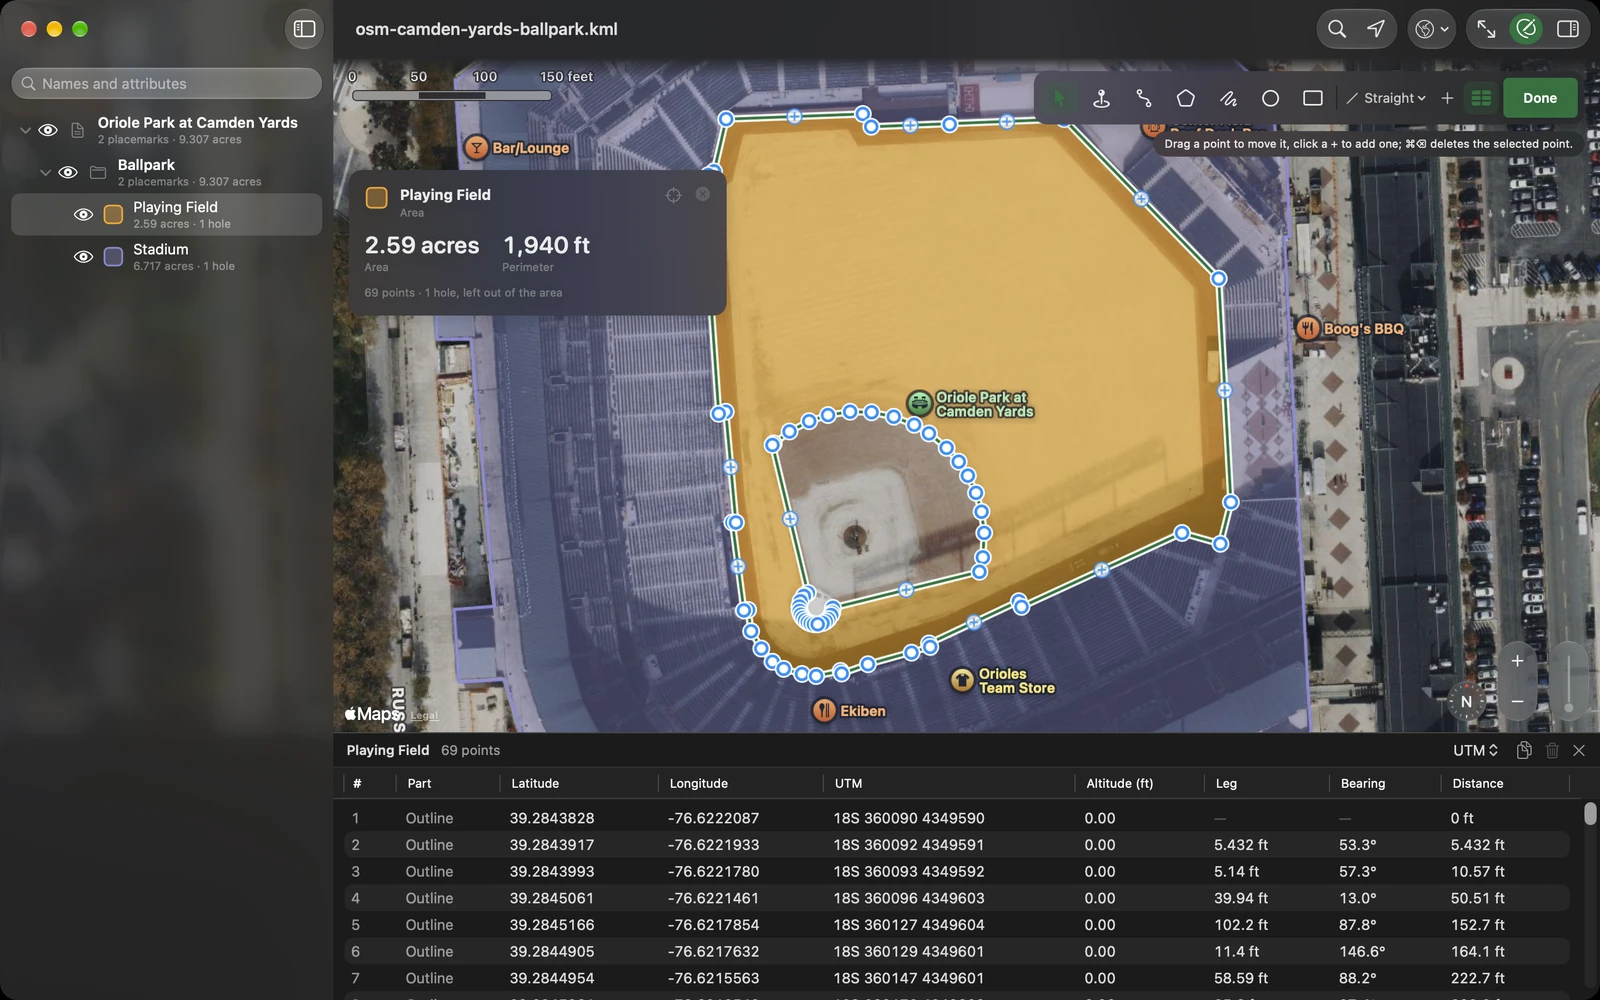
The village is the green itself: registration, bag check and the awards table. Trace it with the Area tool on the satellite map, so you follow the real edge, and draw bag check inside it with the Rectangle tool. If an area has something in it that isn’t usable ground, a pond or a building, select the area and choose Add a Hole in the inspector’s Shape section; the area then measures only the ground around it. The green has nothing like that, so it stays one piece.
Parking and closures
The lots are easiest to trace on the satellite map: pick Satellite or Hybrid from the map style menu, then click a lot’s corners with the Area tool. Here they are the two park district lots by the station, north and west of the green. A gray fill keeps them quiet next to the course.
Closures are paths drawn in red and wide. For a street, set the lines to Follow Roads (Driving) and click its two ends, and as with the course, wait for the leg to land before you end the path. Put the plan in the description: “Closed to traffic from Plandome Road to Abbey Road until the last runner has passed.” A translucent red lets the course show through where the two run together.
Check it the way a volunteer will
The eye beside each row of the layer list switches it on and off. Switch everything off but Water and Course, and you have the map for the water volunteers. Switching layers only changes what you see; it never changes the file. When you do want a copy that opens with only some layers showing, Map ▸ Save Shown Layers to the File writes them into it.
Share it
Give a new map its name and place with File ▸ Save…. From then on the Mac saves it as you go, and iPhone and iPad write your edits back to the file a moment after each one. It is a KML file you can send to anyone. What you draw uses three shared styles that KML Explore adds to the file once, plus each placemark’s own colors, so it opens in Google Earth looking as it does here.
The file stays clean because KML Explore edits the KML itself rather than a copy of what it understood. Open a map someone else made, add your closures and save, and everything else in it stays as they wrote it, down to the digits of the coordinates you didn’t move.
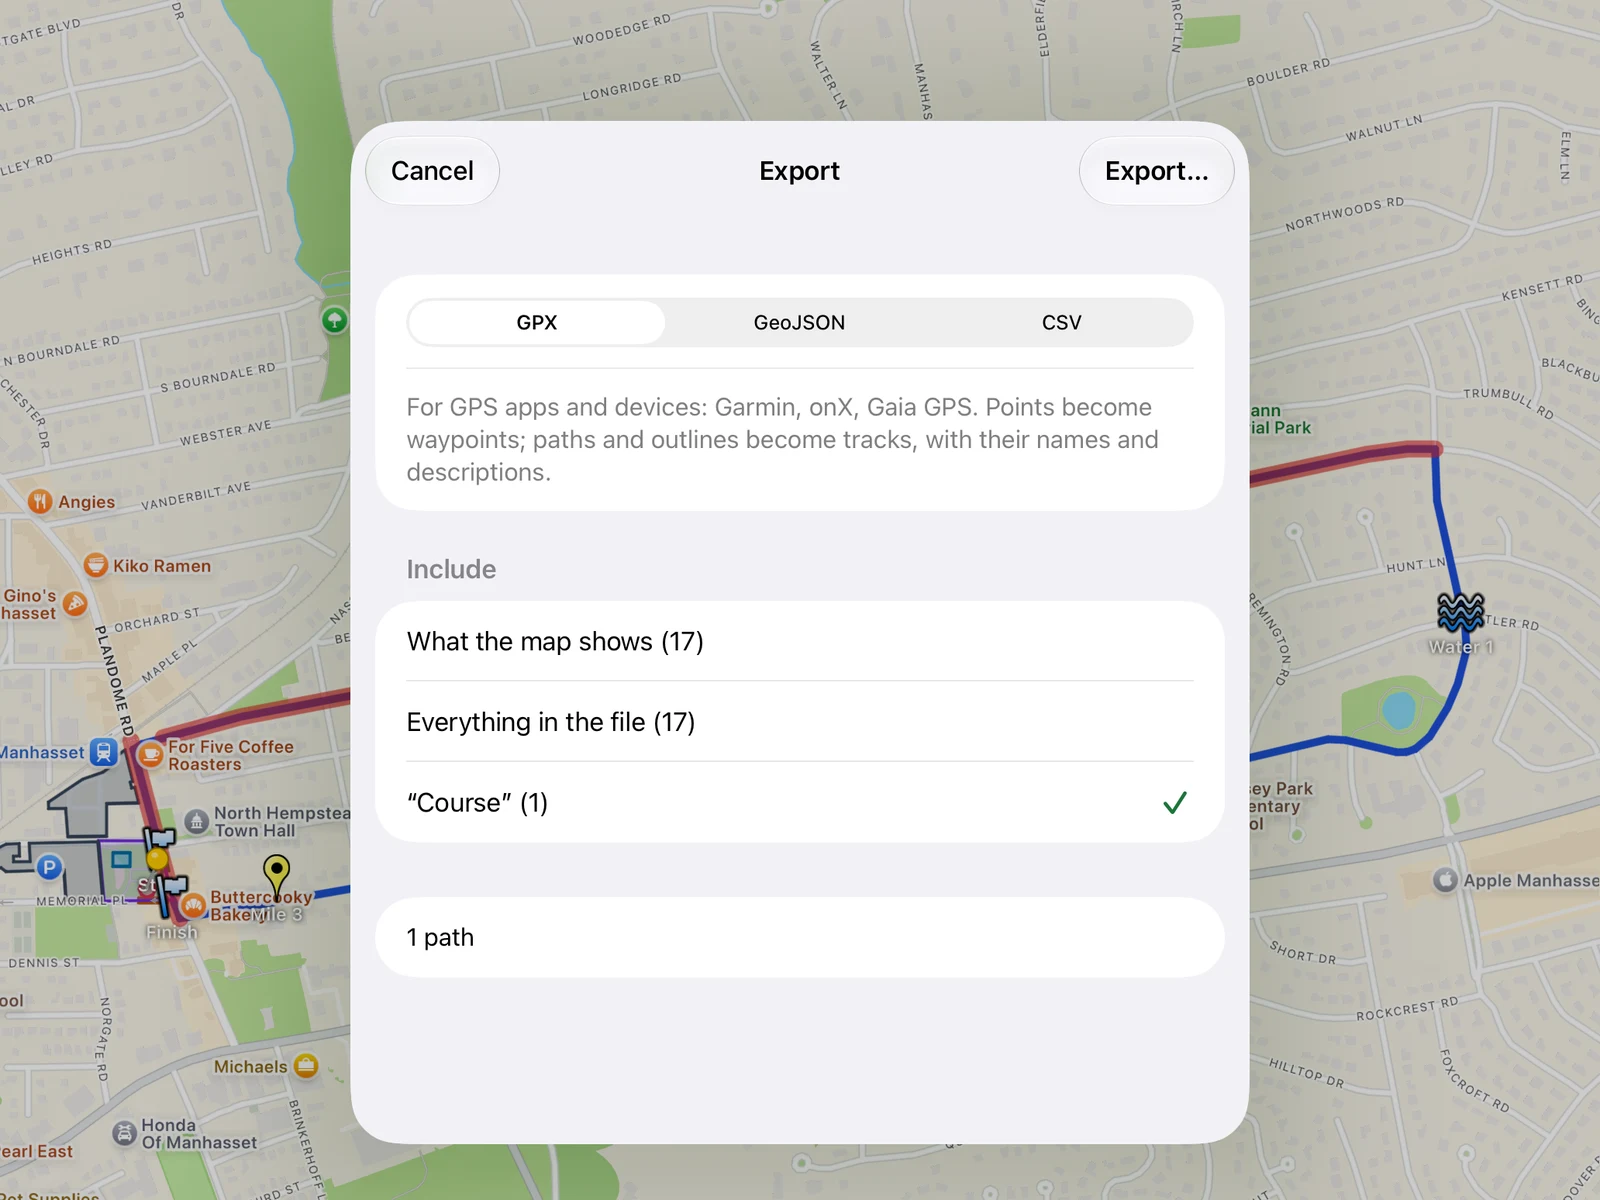
For the people who don’t use KML, File ▸ Export… (⇧⌘E on the Mac) writes a copy as GPX, GeoJSON or CSV. GPX goes on a watch or a bike computer, so the lead cyclist can carry the course. CSV opens in a spreadsheet with a row for each placemark, its folder, position and description. You can export what the map shows, everything in the file, or just the selected folder.
More on each step in the guide: editing a file, folders, names, attributes and styles, holes and shapes, the points table and exporting.