MyFoodAnalysis: exploring 455,000 food records from USDA
FoodData Central, the U.S. Department of Agriculture’s food composition database, brings together analytical measurements, reference tables, survey data and manufacturer labels. It covers hundreds of thousands of foods, from a raw banana to a box of cereal, though the detail varies widely: some records have amino acids and fatty acids, others only a few label values. It is one of the richest public datasets I know. You can also download it as CSV files, which is how this project began.
MyFoodAnalysis is my way of looking at it. It started as curiosity. In August 2024 I loaded the whole database into SQLite over two days and let a language model write SQL against it, just to ask it questions. This month it became a real site.
Food data is not new to us. In 2009 we helped Vistrada build MetabolicPro for GMDI, the Genetic Metabolic Dietitians International: a diet analysis tool that metabolic dietitians use to analyse recipes down to single amino acids, for children whose diets are measured in milligrams. That is where the habit of taking nutrition numbers seriously comes from.
Explore foods by serving
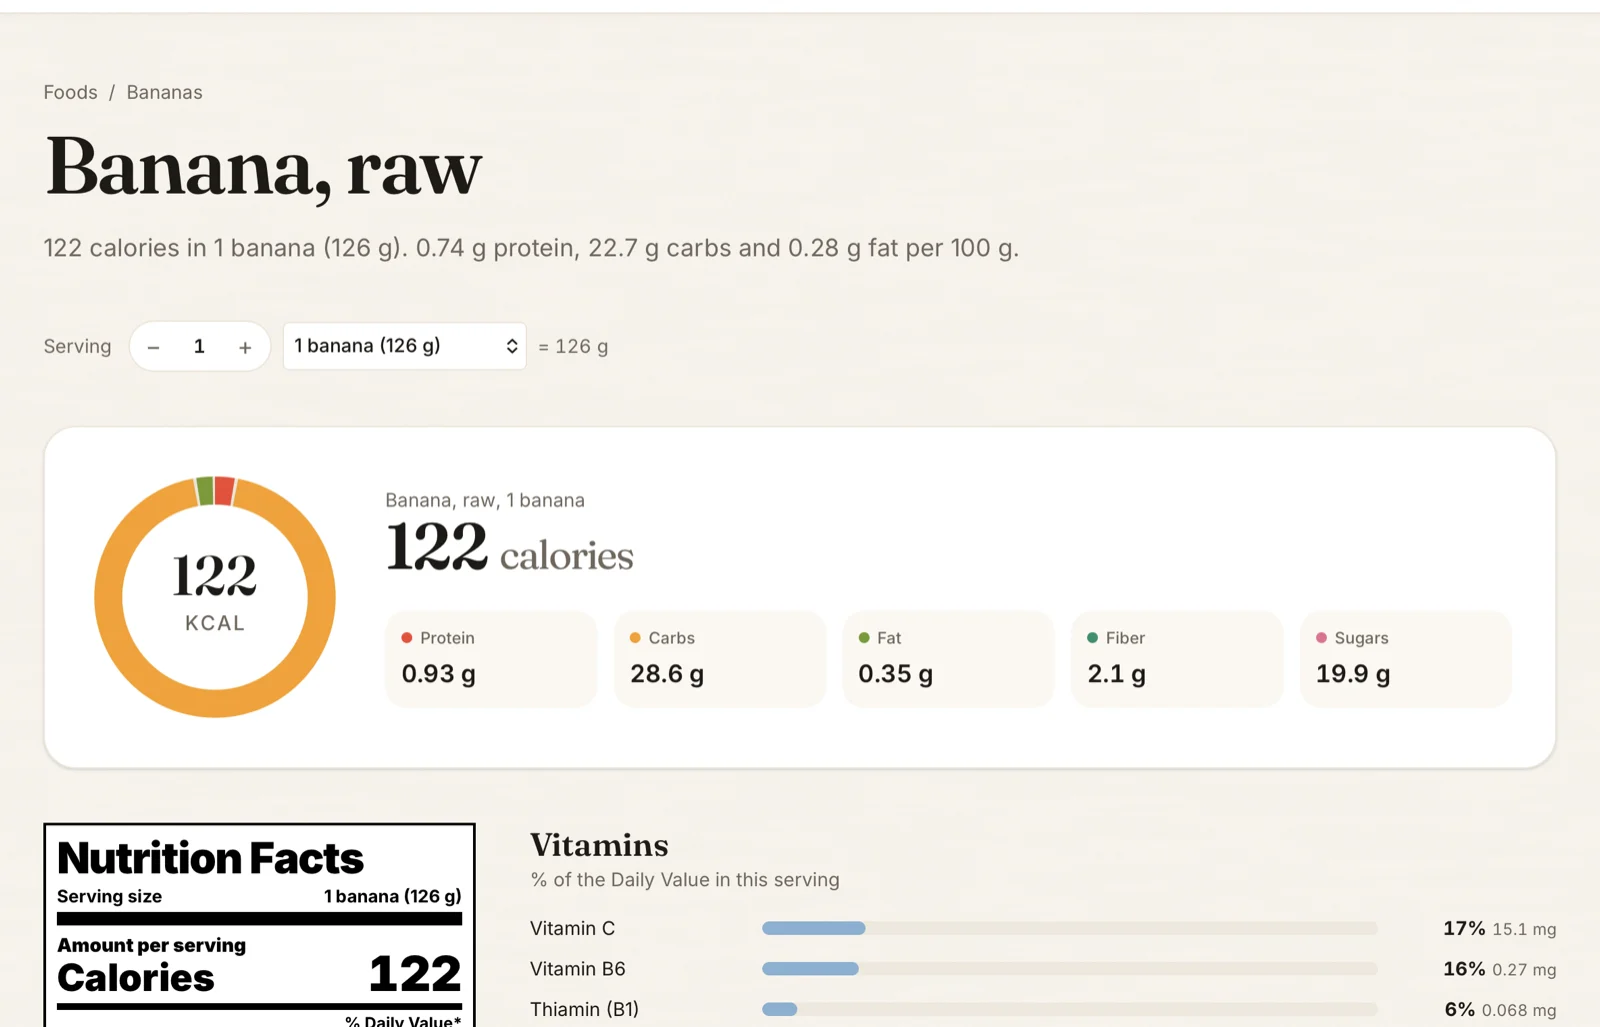
The site uses the April 30, 2026 download and includes 455,801 food records: 13,620 from Foundation, SR Legacy and Survey data, and 442,181 packaged products from their labels. Each record has a page. We choose an available portion as its default, such as one banana, with 100 grams as a fallback. The interactive nutrient panels follow the serving you pick; the source table and comparisons keep the basis stated in their headings. A serving choice is for exploring the data, not a recommendation about how much to eat.
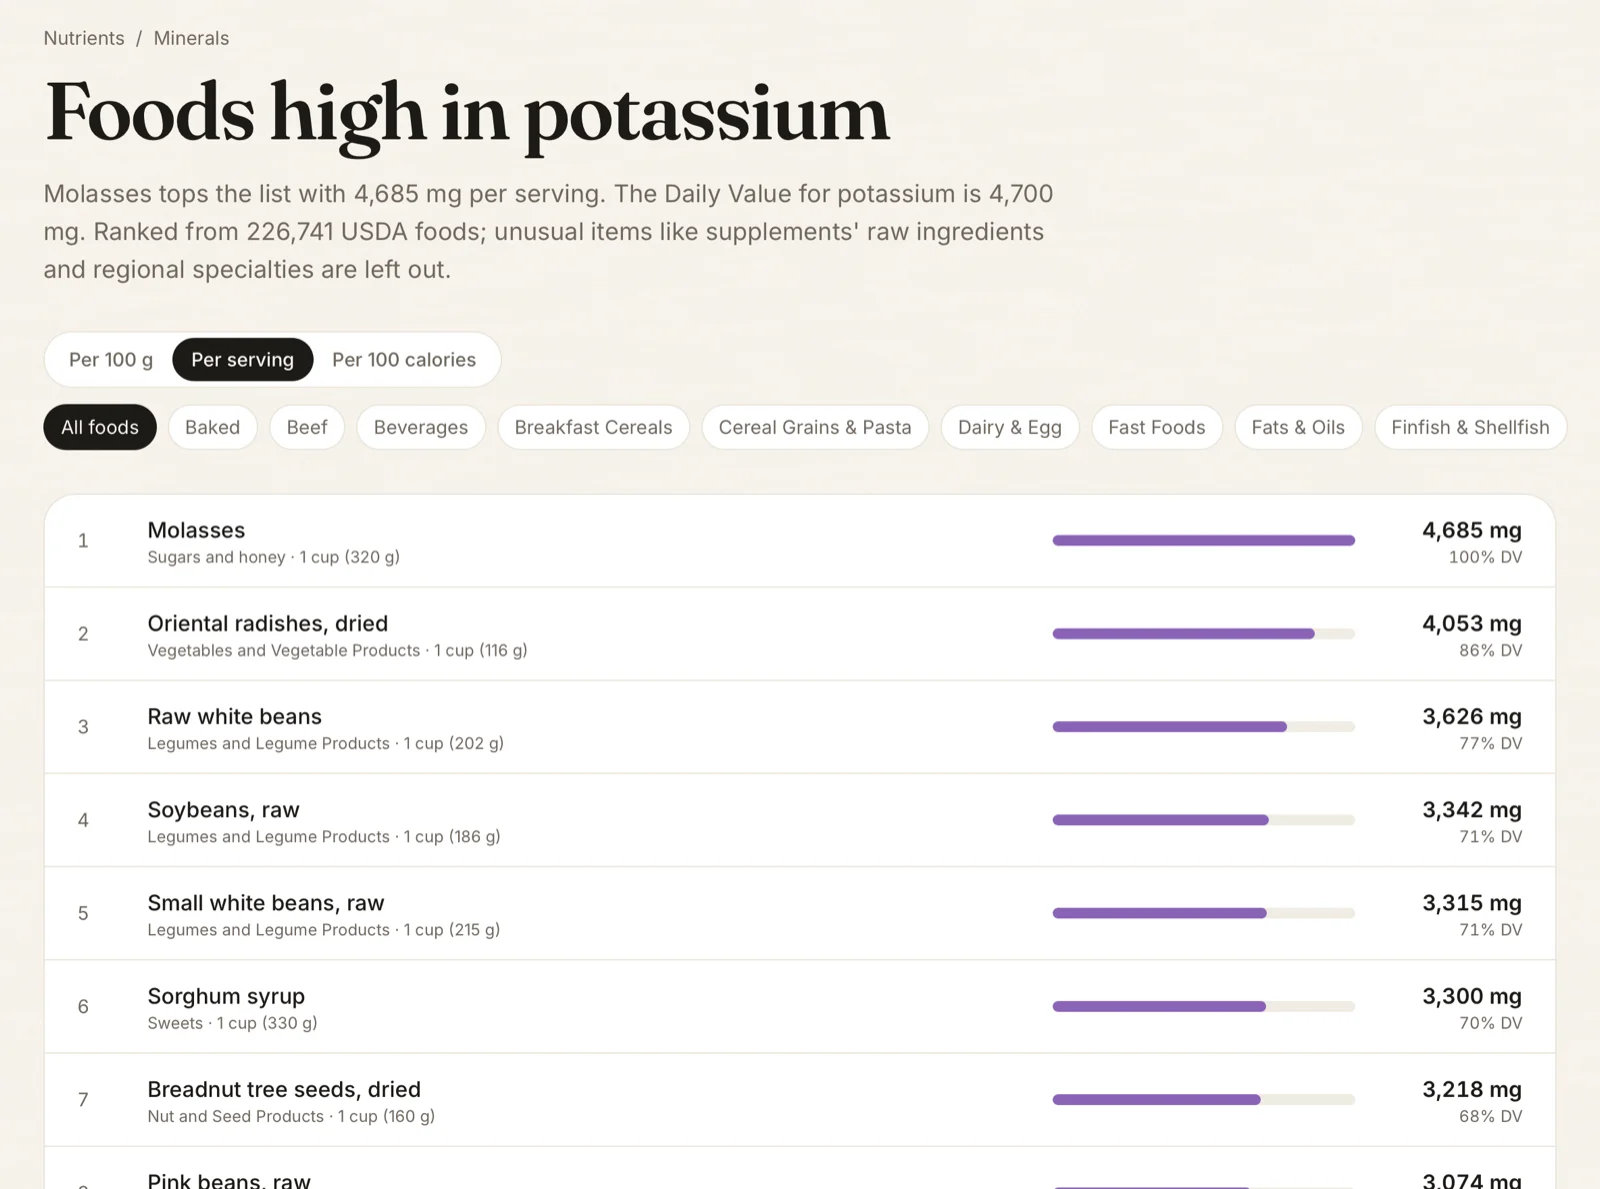
Then there are nutrient rankings per 100 grams, per serving or per 100 calories. Their default view uses our everyday-food filter, which excludes categories such as dried spices and protein isolates. Comparing 100 grams of dried thyme with a serving of beans can be misleading, so the choice of basis matters.
The Food Finder
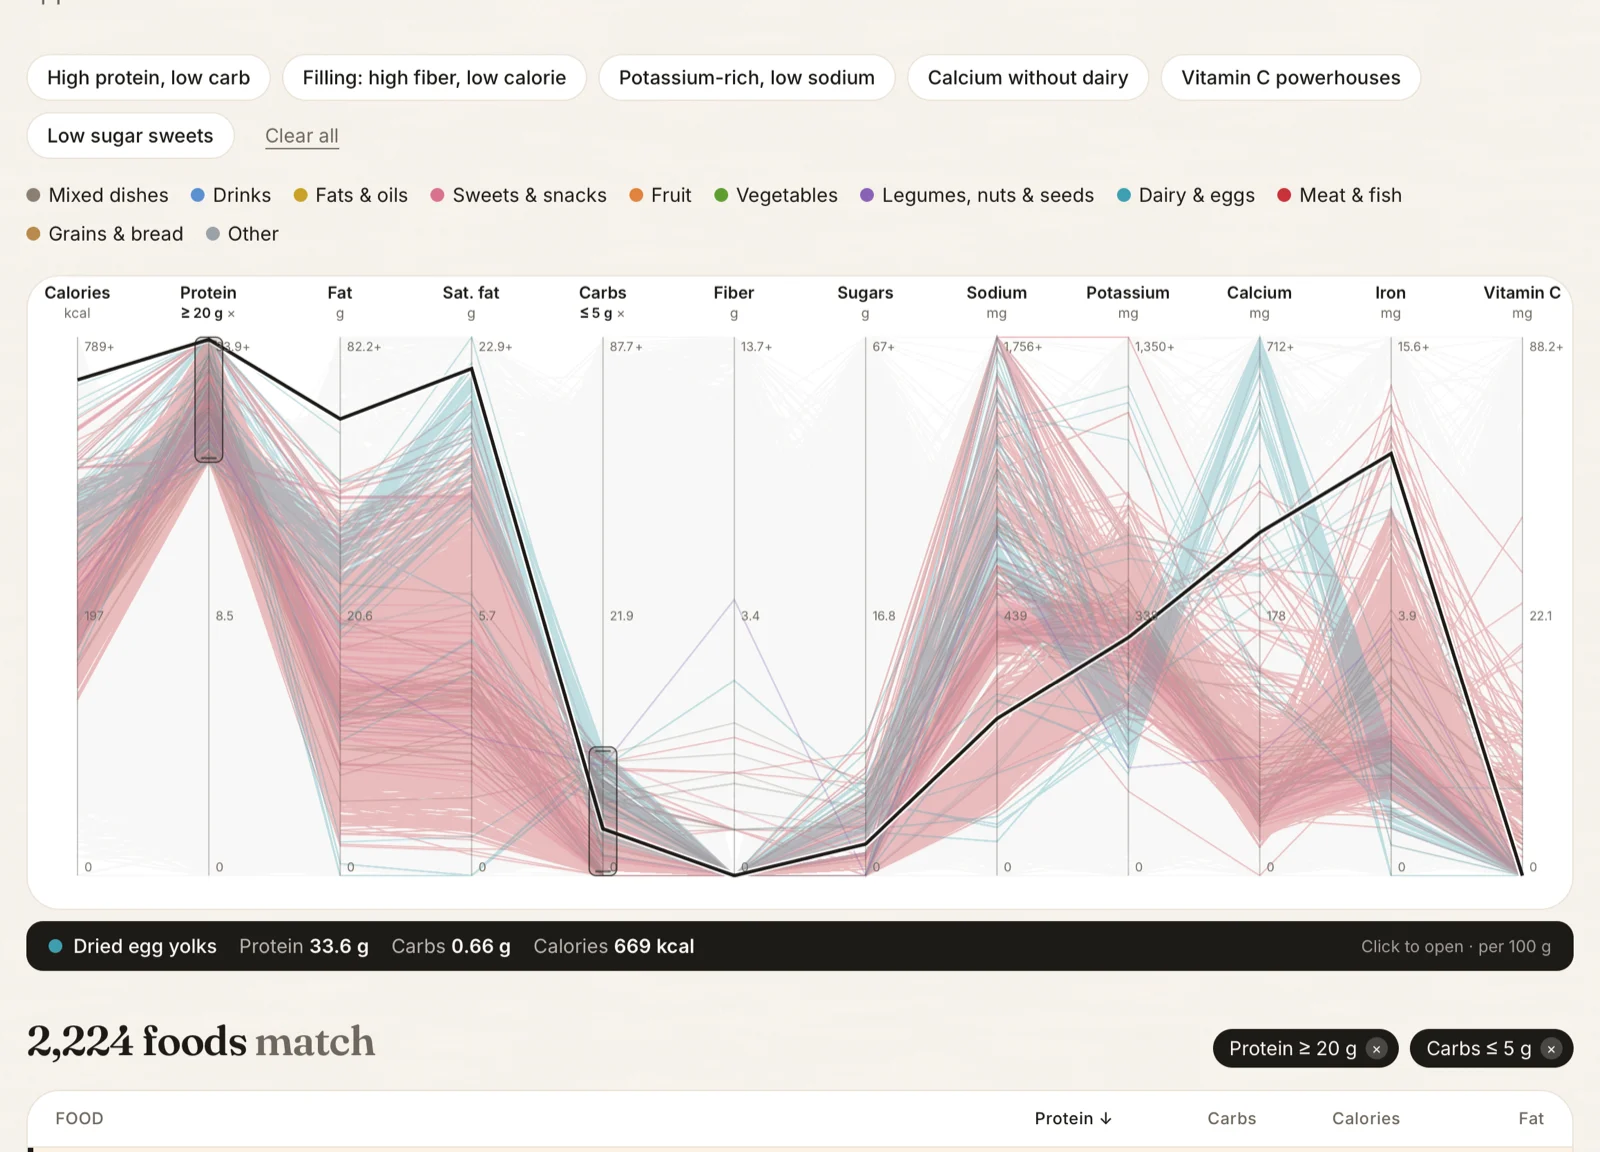
The part I built for myself is the Food Finder. Years ago Kai Chang made a d3 visualization of USDA’s nutrient database as parallel coordinates: every food is a line running across a row of nutrient axes, and you drag a box on any axis to keep only the foods that pass through it. I loved it, and I always wanted it to be a tool rather than a demo.
So here it is, with twelve nutrients and about 12,700 generic food records, each line coloured by its food group. In this release, protein of at least 20 grams and carbohydrates of at most 5 grams per 100 grams leaves 2,224 matching records. Slide a box and the list changes as you move. Hover over a line and that food is named under the chart and jumps to the top of the list. Every filter is a link, so you can send someone exactly what you found.
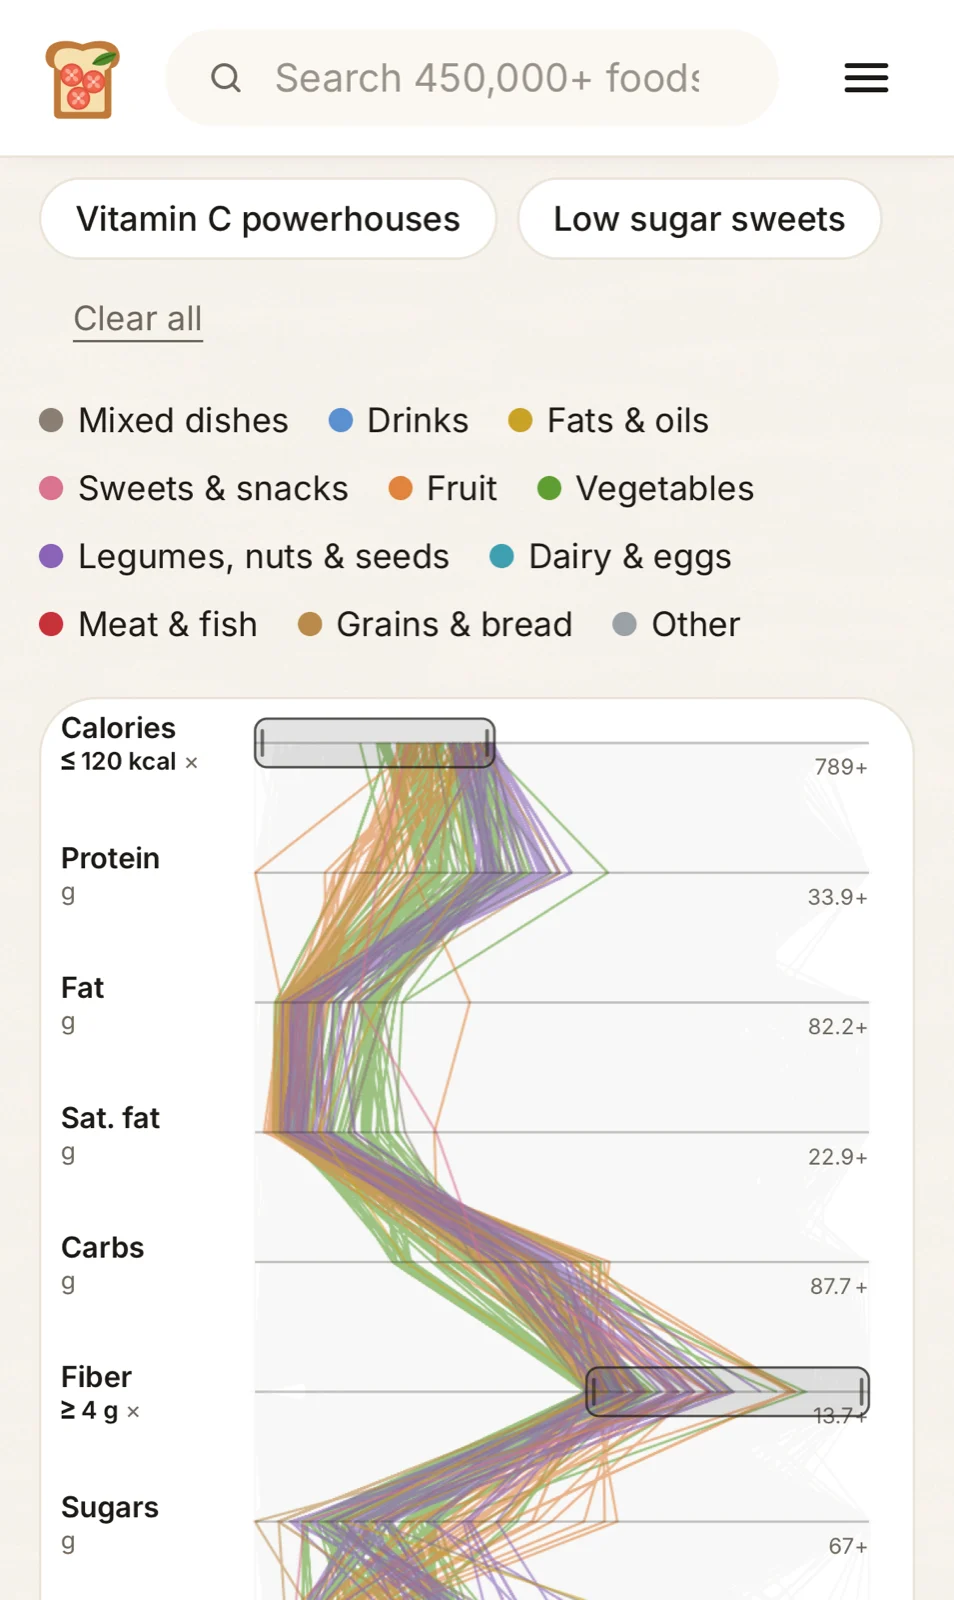
On a phone the axes lie down, so the chart reads from top to bottom and you drag along an axis with your thumb.
What we did to the data
A site like this is only as good as its numbers, and the honest thing is to say exactly what we did to them. We keep USDA’s reported values in the full source table. Where we estimate a value, the site labels it Estimated and explains the assumption. Building it taught me things about the data that I did not expect.
We select records from the download. We include Foundation, SR Legacy and Survey foods and selected branded records, leaving out Experimental Foods, individual samples and 74 older generic records. Older IDs redirect when our matching rules find a replacement; some have no replacement. This is not every record FoodData Central holds.
Packaged products repeat. We select the latest record per barcode from about 2 million branded records in the download. That gives about 442,000 products. “Latest” here means latest in that download: USDA’s online branded database can have newer information, and the label on a shop shelf may differ.
Some nutrients are recorded more than once, in different ways, so we always pick the same one in a fixed order. Carbohydrates are what is left of 100 grams after water, protein, fat and minerals are weighed, and for ten raw meats and fish the small errors in those measurements leave a slightly negative number. We show zero; the full table keeps USDA’s exact figure.
An estimate should look like an estimate. If calories are missing but protein, carbohydrate and fat are all reported and their combined amounts are plausible, we estimate calories using 4, 4 and 9 calories per gram, plus 7 for alcohol when it is reported. Unreported alcohol is assumed zero. Missing fiber makes net carbs an estimated upper bound, because we cannot subtract fiber we do not know. Some packaged liquids are supplied per 100 millilitres; converting those to grams assumes 1 millilitre weighs 1 gram, so those values are marked Estimated too. The source table keeps its original basis. If we do not have enough information to calculate an estimate, we say the value is not reported.
The names read like a library catalogue. USDA writes “Fish, salmon, Atlantic, wild, cooked, dry heat”. People search for “wild Atlantic salmon, cooked”. So an AI model proposed shorter names for about 13,400 foods, with instructions to preserve details that change the nutrition. Code checks every name for the details that change a food, such as raw or cooked, reconstituted or not, salt, processed, powdered or frozen, fat level and percentages, and a name that drops one is not used; about 620 foods keep USDA’s wording. A review of our work caught names that had lost exactly those distinctions, a diet drink powder named like the prepared drink, processed Swiss cheese named like plain Swiss, and the stricter checks came out of it. Names never decide which records are the same food: that takes identical USDA descriptions and matching numbers. USDA’s own description is on every food page so you can check which record you are looking at.
Then we check the import. The public tests compare selected food IDs, descriptions and a fixed random sample of 300 foods’ raw nutrients with the CSV files. Our separate API tests use a saved September 24 snapshot of 20 foods: 17 current records get nutrient comparisons with rounding tolerances, and three older records get redirect/removal checks. Consistency tests check calories and relationships such as saturated fat within total fat, but permit specified exception rates. Some records still contain gaps or inconsistencies. Passing the tests checks our processing; it does not establish that every food value or AI name is correct.
The whole list, in plain words, is on How we build MyFoodAnalysis.
Open, so you can check it
How we prepare the data is open source: github.com/objectgraph/myfoodanalysis-data. The corresponding code version, USDA download and included name file let you reproduce that processing. The public tests cover the CSV import and consistency rules; the website, API service and saved API comparison tests are private. Tests that need source files skip when those files are absent, so the test summary matters.
A scheduled check looks for a newer USDA download every Monday and opens an issue when it finds one. Importing, testing and publishing it are manual steps. This site is a snapshot, not a live feed of USDA’s changes. The methodology describes these limits alongside the processing rules.
What is next
Accounts, so you can keep a food log and see a day or a week against your targets, and recipe analysis: put in your ingredients and servings and get the whole analysis per serving, amino acids included. That is where MetabolicPro started, seventeen years ago.
MyFoodAnalysis is free to use and needs no sign-up to explore: www.myfoodanalysis.com.