iSeismometer 1.7: from a novelty app to a home seismic network
In February 2009 we put a free app on the store that did one thing: leave your iPhone on the desk, tap nearby, and watch the trace jump. It kept ten seconds of data and showed the last three, had a spectrum screen, and could upload what it saw to a PHP script on our server. Two months later the L’Aquila earthquake hit Italy and the app went to number three among free apps in the Italian store, four thousand downloads a day. By October two hundred thousand people had it. A reviewer in the Independent Guide to the iPhone 3GS admitted he did not understand the chart but promised it would make you look über-intelligent to anyone looking over your shoulder. In 2011 the BBC filmed an earth-science lab at Long Island University running it on a room full of iPads. Someone on YouTube used it to show the resonance of his guitar.
Then, like most of our early apps, it coasted. A Swift port in 2024 kept it on the store, but it was still the 2009 idea, and the phone in your pocket is a far better sensor than the iPhone 3G ever was.
Over Labor Day weekend I rebuilt it. Version 1.7 is one SwiftUI codebase for iPhone, iPad and Mac, and the Mac is not a port of the phone app. It is a receiver.

The phone is now an instrument
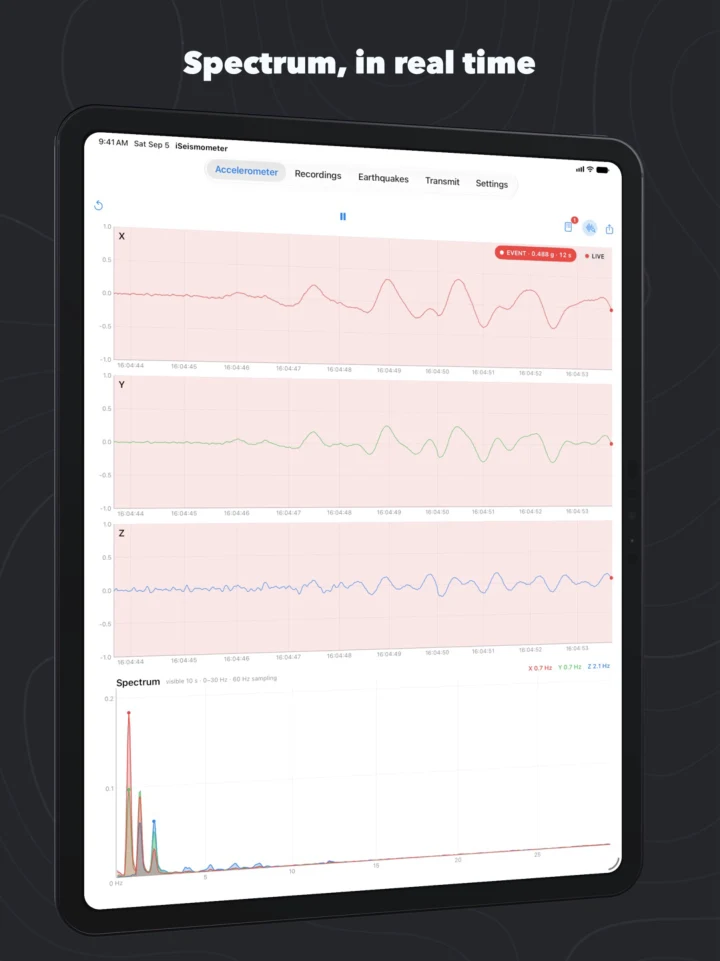
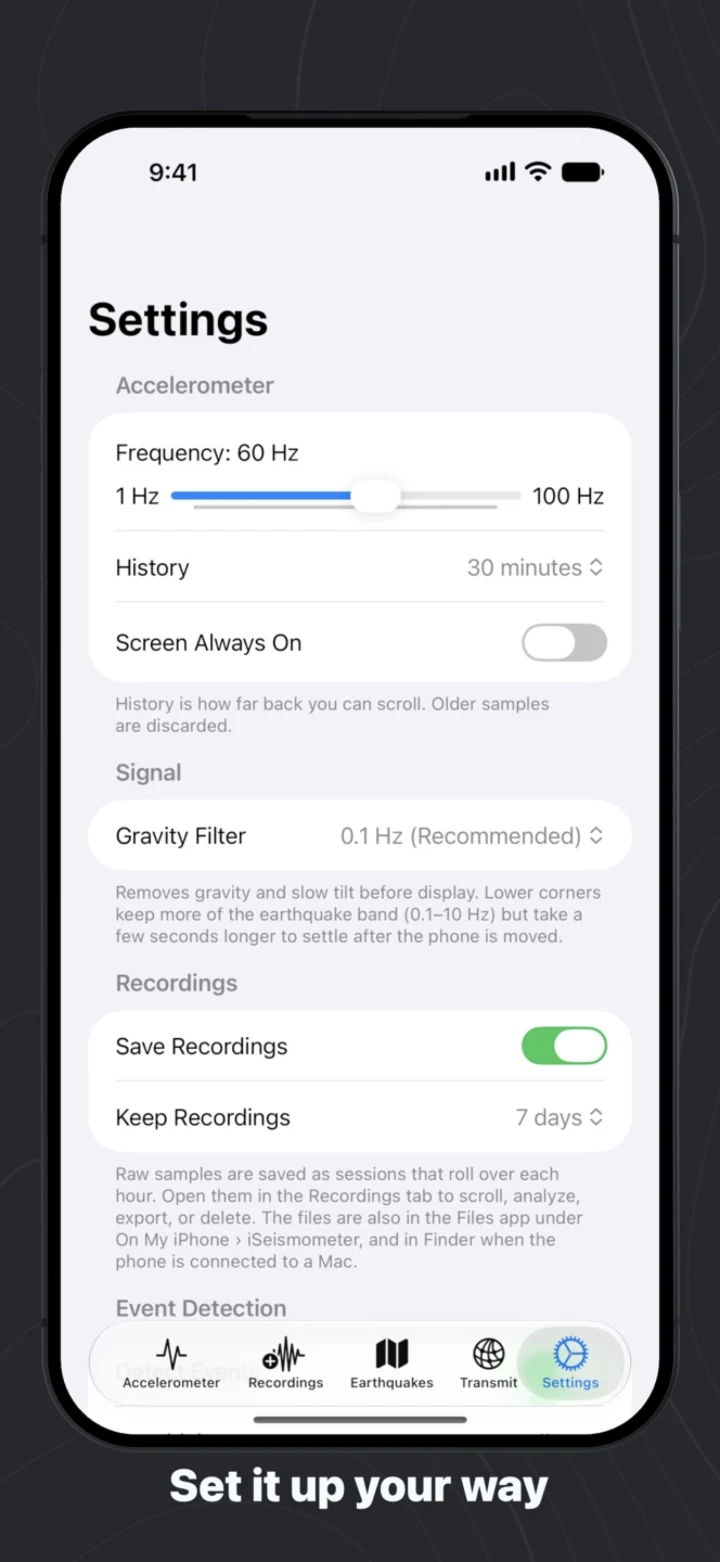
The screen is a strip-chart recorder: ten seconds of paper with the live trace pinned to the right edge, and you can drag back through up to an hour of history. Sampling is selectable from 1 to 100 Hz, default 60. Three axes, red, green and blue, on every platform.
Under the trace, the numbers are honest. Raw accelerometer data includes gravity, so a phone lying flat reads about −1 g on Z. The 2009 app removed it with a one-pole smoother. Version 1.7 uses a second-order Butterworth high-pass with a physical corner, 0.1 Hz by default and adjustable from 0.05 to 1 Hz, and the old smoother is still there under “legacy” if you want the 2009 behaviour back. The spectrum is a Hann-windowed DFT through Accelerate, with the dominant peak marked per axis.
The new part is the event detector. It runs the classic STA/LTA trigger on the gravity-free magnitude: a half-second short window against a thirty-second long one, with three sensitivities. When the ratio trips, an event opens. When the shaking settles, the event closes and records its peak amplitude in g and its dominant frequency from a spectrum of just that window. Footsteps and an earthquake look different by that number. The earthquake’s energy sits below 3 Hz.

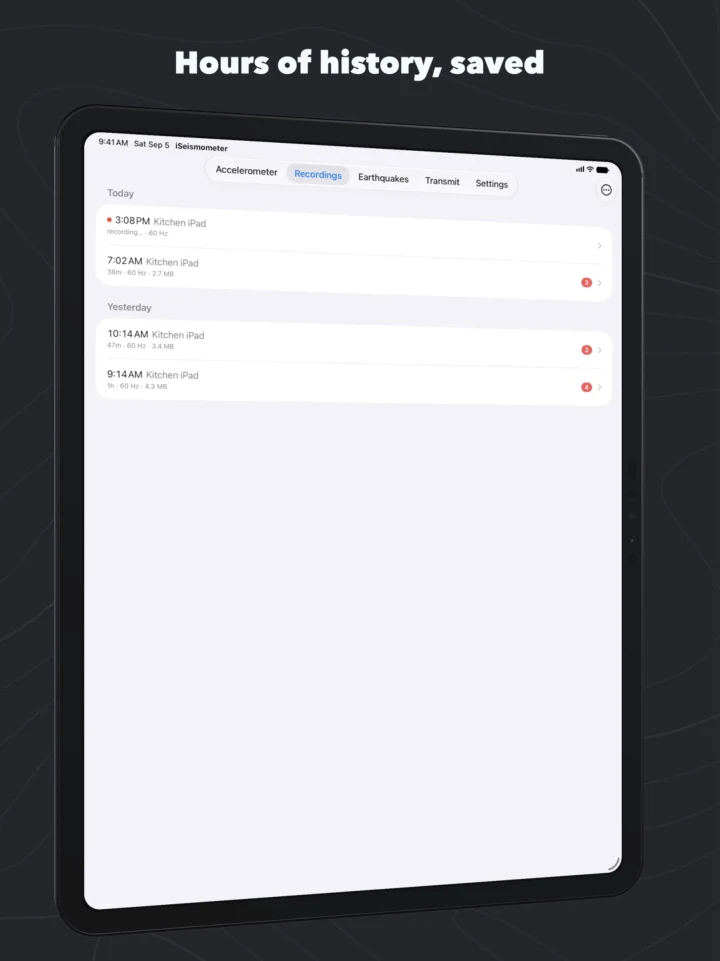
Recording is on by default. Sessions are written in hourly files and kept for seven days, and every event is listed with its trace, so you can open a recording at the exact moment the detector fired.
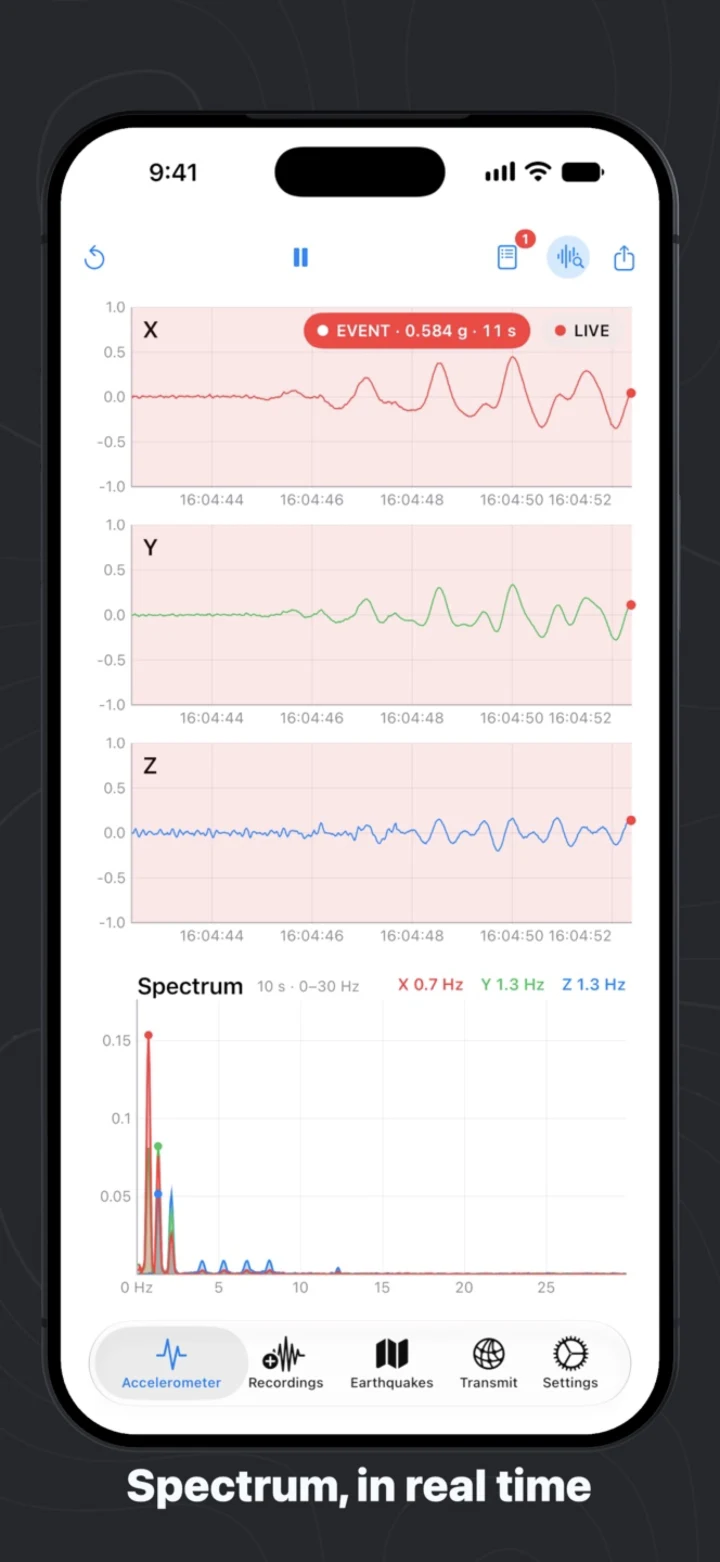
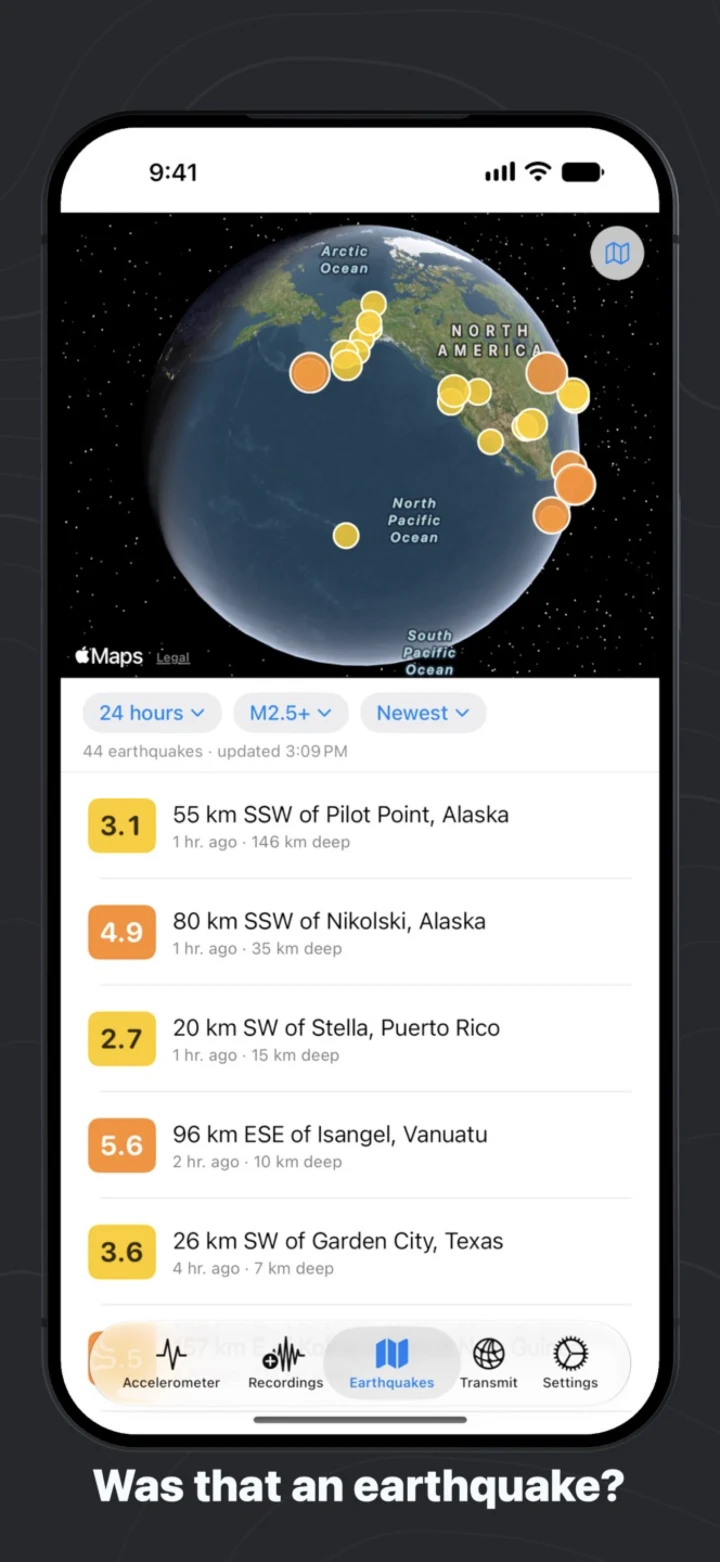
The Earthquakes tab pulls the USGS feed, filtered by time window and minimum magnitude, onto a globe over a list. On iPad the same instrument gets the room it deserves.
The Mac is a receiver
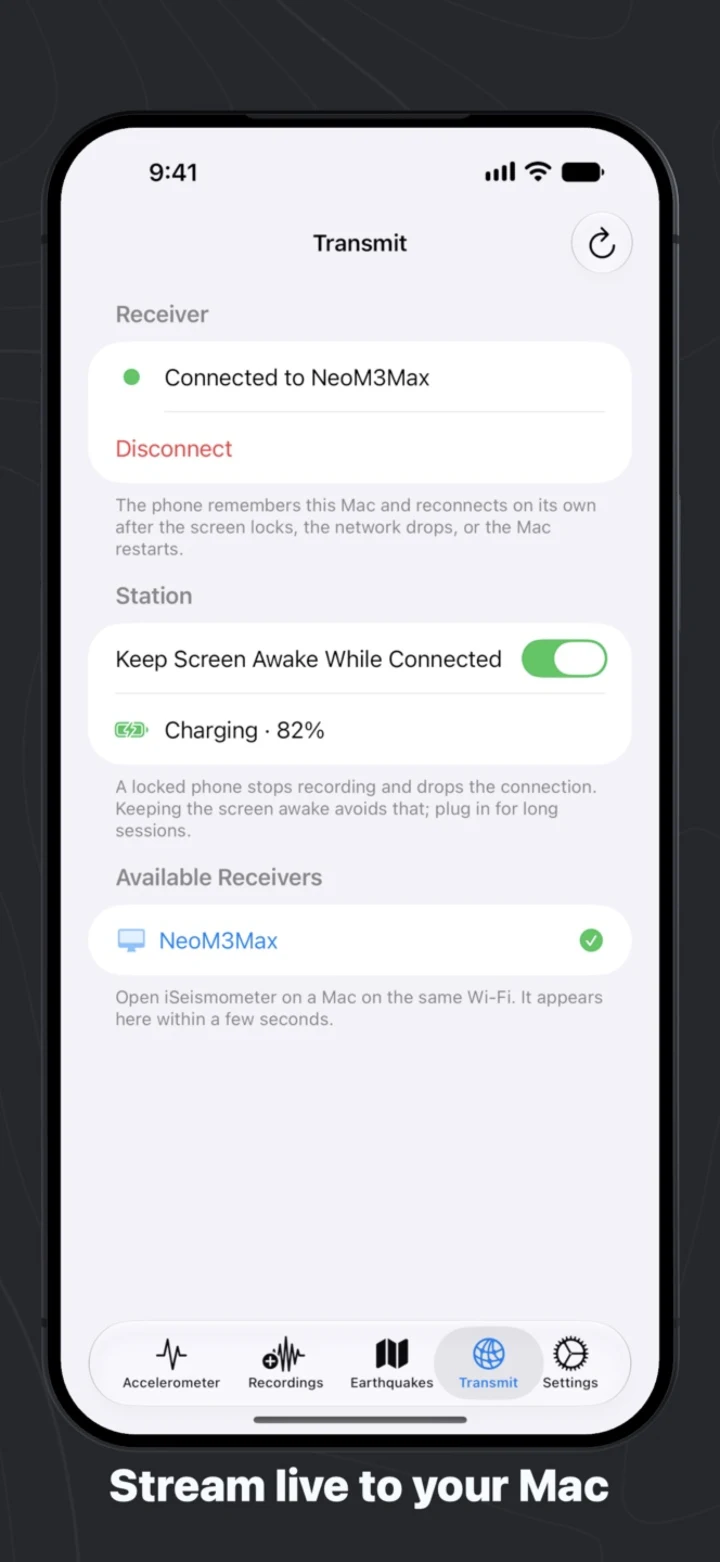
Open iSeismometer on a Mac and it announces itself on the local network over Bonjour. On the phone, the Transmit tab lists the Macs it can see; pick one and the phone streams to it.
The Mac shows every connected device as a channel strip with a status light, its rate, a sparkline and a level meter, and it runs the same filter and detector on every stream that the phone runs on itself. The Mac does not sense motion. It receives, records, analyses and archives what your phones and tablets feel.
The wire protocol is newline-delimited text, one TCP connection per sensor, sensor to receiver only:
#hello,<deviceID>,<device name>,<model identifier>,<frequency Hz>
#channels,<deviceID>,<name:unit>[,<name:unit>...]
#battery,<deviceID>,<level 0-1 or -1>,<1 if plugged in else 0>
<deviceID>,<unix timestamp seconds>,<v1>[,<v2>,...,<vN>]
Channels are declared with a unit, and only channels in g are high-passed for display; everything else passes through as sent. That is what makes it a network rather than an iPhone accessory. A Raspberry Pi with an accelerometer, or a watch with gyroscopes, can announce six channels and appear in the control center beside the phones with its own traces, spectrum and events. The screenshot at the top has a six-channel watch in it. There is a minimal Python station on the Data page of the site.

Data you can actually open
Each session is a .bin and a .json. The binary is a flat array of little-endian records with no header: eight bytes of microseconds since the session started, then a Float32 per channel, raw, gravity included. The sidecar carries the device, the nominal rate, the channel list and the events. On the phone the folder is visible in the Files app, on the Mac it is in Application Support, and the share button hands you a CSV in a zip.
NumPy reads a session directly, and the same code works for a three-axis phone and a six-channel watch:
import json, numpy as np
meta = json.load(open(f"{SESSION}.json"))
chans = [c.split(":")[0] for c in meta["channels"]]
a = np.fromfile(f"{SESSION}.bin", dtype=np.dtype([("t_us", "<u8")] + [(c, "<f4") for c in chans]))
t = a["t_us"] / 1e6
Every snippet on the Data page was run against a real recording written by the app, and those plots are its output. There is no account, no analytics and no server. The only network traffic is the USGS feed you ask for and the stream to a Mac you chose on your own network.
seismograph.com
The old iseismometer.com was two static pages. The new site is seismograph.com, and the brief for it was “a measurement instrument, not a landing page”: numbered sections, monospace labels, spec tables, real byte layouts and real code, no gradients. It has a page on what the phone is measuring, the Data page with the format and the Python, a Mac page, and a simulator where you pick a magnitude, a depth and a distance, watch the P and S waves race to the station, and see what a phone on your table would record. iseismometer.com now redirects there.
Seismograph is the name of the site and the project. iSeismometer stays the name of the app on the App Store, where it has lived since 2009.
The screenshots are real
The App Store screenshots are not mockups. A script launches the real app in the simulator with arguments that seed three finished sessions, planted footsteps, a bump and an earthquake, and the production filter and detector produce the events you see in them. Two simulators stream to the Mac over Bonjour while it runs, and a fake six-channel watch joins as the third device.
Get it
iSeismometer 1.7 is on the App Store for iPhone, iPad and Mac. Leave it on the desk. Tap somewhere.