[How to use iSeismometer] Part2 - Play with Spectrum
“Spectrum” is an experimental portion of this iSeismometer. Waves of earthquake can be categorized two major parts: P-wave and S-wave. P-wave shake rapidly and it goes faster. S-wave goes slower than P-wave but it”s more destructive wave. I initially planned to detect P-wave of the seismic wave which arrive faster than destructive S-wave when an earthquake hit. Then I read a couple of articles and one of the way to identify the earthquake arriving time is to detect P-wave”s cyclic patterns of shaking. If it”s cyclic signal (like you shake your desk repeatedly at same intervals), is this something we can extract “how many times shaked” in the iPhone? Of course, the answer is yes.
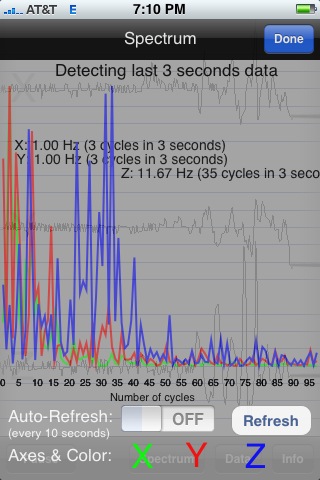
[caption id=“attachment_238” align=“alignnone” width=“200” caption=“spectrum with juggy spikes”]
Figure 2
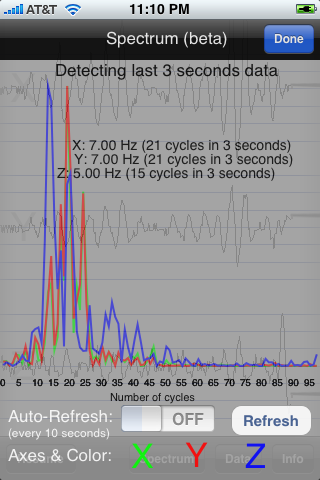
The spectrum shows the result of Fourier Transform. This is my first version so I implemented in quick way but it will be optimized in the future, so that it can reduce the computation time (like O^2 to O(log)). I”m working on this better version now so there are no time lag after you hit the Spectrum button.
When it analyze the data, what you see is clear spike(s). If you have clear spike, it means, you have repeated cycles in the last 3 seconds. If you compare Figure1 with Figure2, the first one has clear spikes than the second one because I shake iPhone repeatedly with good rhythm. 7Hz means you shake your iPhone 7 times per second as the average. However the second one shows totally messed up spikes because I shake my iPhone at random.
